U.S. crude oil and natural gas production both fell in 2016
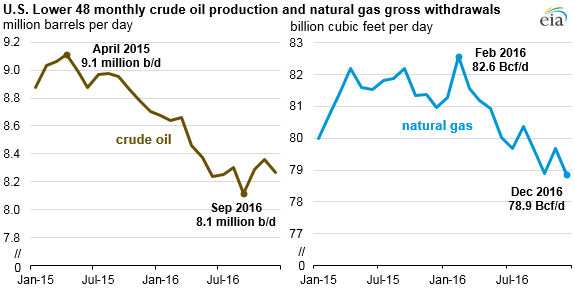
Based on data in EIA’s Monthly Crude Oil, Lease Condensate, and Natural Gas Production Report, average crude oil production in the Lower 48 states fell to 8.39 million barrels per day (b/d) in 2016, a decrease of approximately 0.55 million b/d, or 6.1% from the 2015 average. Natural gas gross withdrawals in the Lower 48 states also decreased in 2016, averaging 80.39 billion cubic feet per day (Bcf/d), or 1.03 Bcf/d (1.3%) lower than in 2015. EIA now has two complete years of monthly survey-based data on crude oil and natural gas production since expanding the EIA-914 survey in 2015.
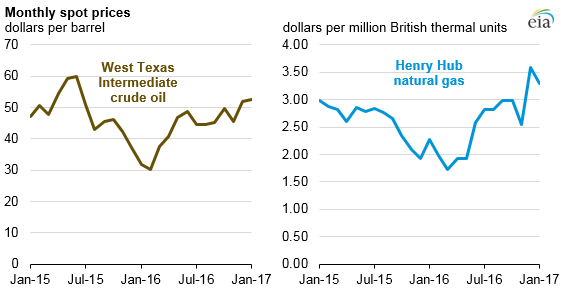
After declining throughout 2015, crude oil and natural gas prices began to recover in 2016, increasing through much of the year, which drove production increases in the second half of 2016. The price for West Texas Intermediate (WTI) crude oil, after reaching a monthly low of $30 per barrel (b) in February 2016, began to increase in March and most recently averaged $53/b in January 2017. Natural gas gross withdrawals increased in August and November 2016 as Henry Hub natural gas prices rose from an average of $2.00 per million British thermal units (MMBtu) in the first quarter of 2016 to an average of $2.88/MMBtu in the third quarter of 2016. Natural gas and crude oil prices are expected to increase in 2017 and 2018.
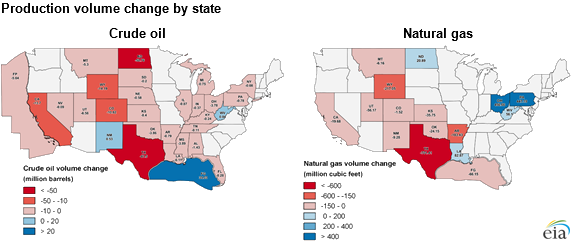
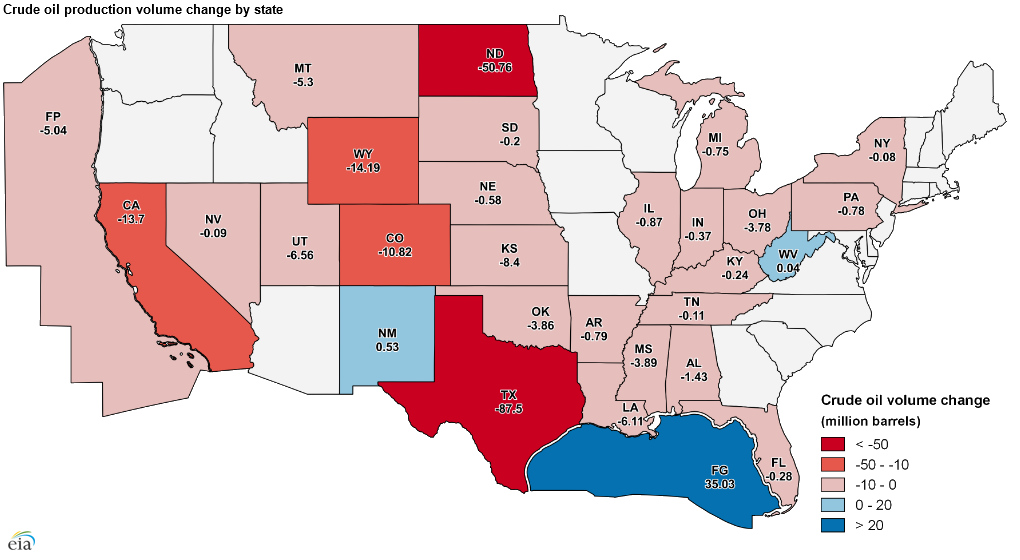
Note: Click to enlarge the crude oil and natural gas production maps.
The largest increase in crude oil production was in the Gulf of Mexico, which increased 96,000 b/d (35 million barrels) from 2015 to 2016 as new projects, which were planned in 2012–14, began to come online. Onshore crude oil production saw small increases in New Mexico and West Virginia, partially in response to higher WTI crude oil prices.
Texas oil production had the largest volumetric decrease at 239,000 b/d (87.5 million barrels). Texas crude oil production declines were partially offset by production increases in the Permian region, where producers continued operations while prices were low and increased drilling rig counts as WTI prices increased. The largest production decline on a percentage basis occurred in the Federal Offshore Pacific, where production declined 44% in 2015, due in part to a pipeline disruption in May 2015.
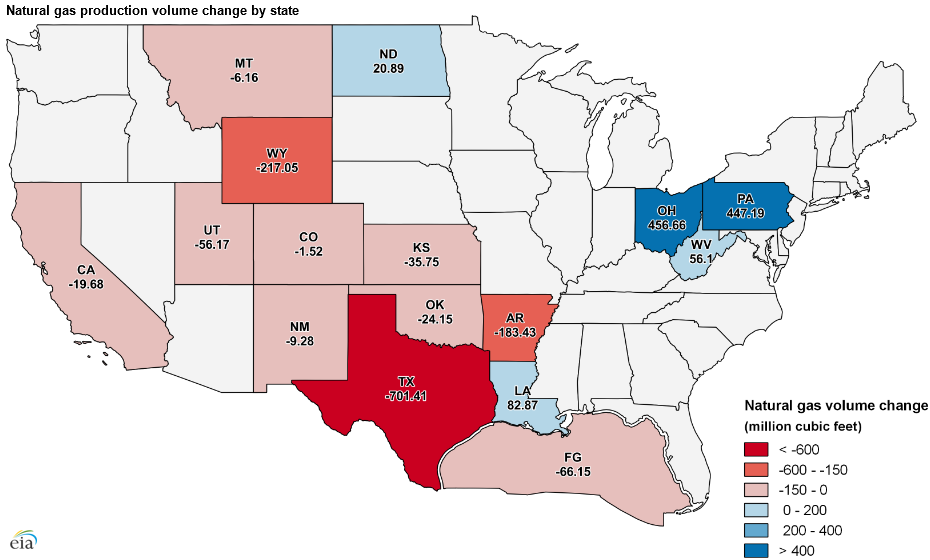
Annual natural gas production increased from 2015 to 2016 in Pennsylvania and Ohio, reflecting higher production from the Utica and Marcellus shale plays. In Ohio, natural gas production in the Utica Shale, including the Point Pleasant formation, has continued to increase since 2011 because of increases in production efficiencies and favorable geologic conditions. Efficiency improvements in horizontal drilling and hydraulic fracturing in the Marcellus Shale have also driven natural gas production increases in Pennsylvania and West Virginia. Outside of the Marcellus and Utica regions, annual natural gas production fell because of lower natural gas prices.
EIA’s Monthly Crude Oil, Lease Condensate, and Natural Gas Production Report collects monthly oil and natural gas production data from a sample of operators of oil and natural gas wells in 15 states, the Federal Offshore Gulf of Mexico, and collectively from the remaining states and the Federal Offshore Pacific. EIA published the first survey-based reporting of monthly crude oil production in August 2015.
The survey covers roughly 90% of crude oil and natural gas production in the Lower 48 states, improving EIA estimates of total production. Previous estimates of U.S. crude oil production were based on tax and production data obtained directly from state agencies that may have been incomplete at the time of publication. EIA’s survey-based data collection provides a more consistent, timely way to assess production trends across states.
Principal contributors: Emily Geary, April Volke
Tags: crude oil, liquid fuels, natural gas, production/supply, states