Average number of televisions in U.S. homes declining
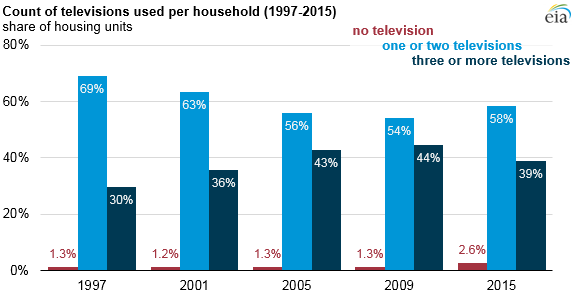
Results from the U.S Energy Information Administration’s most recent Residential Energy Consumption Survey (RECS) show that an average of 2.3 televisions were used in American homes in 2015, down from an average of 2.6 televisions per household in 2009. The number of homes with three or more televisions declined from the previous survey conducted in 2009, and a larger share of households reported not using a television at all. Televisions and peripheral equipment such as cable boxes, digital video recorders (DVRs), and video game consoles account for about 6% of all electricity consumption in U.S. homes.
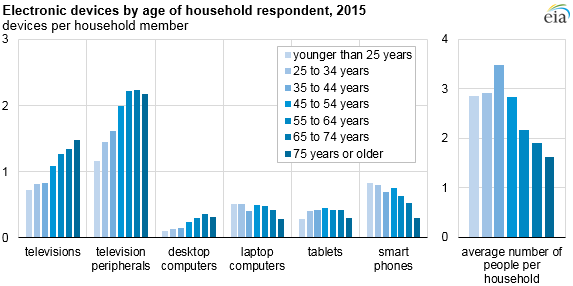
Data from the 2015 RECS highlight the variability and trends in energy use across the nation’s more than 118 million single-family homes, apartments, and mobile homes. Entertainment and information devices, in particular, vary by age: younger households tend to have a lower concentration of televisions per person and a higher concentration of portable devices such as laptops and smart phones. Older households are more likely to have higher concentrations of desktop computers.
EIA’s 2015 RECS Household Survey captured more than 200 energy-related items from more than 5,600 households. Several questions remained similar to those in previous surveys, allowing time-series analysis using RECS data back to the late 1970s. However, as energy use in households changes, EIA adds or revises questions. The 2015 survey was the first to include questions about tablets, smart thermostats, and light-emitting diode (LED) lighting.
Prior to the 2015 survey, field staff collected all RECS household characteristics data in person. The 2015 RECS is the first time online questionnaire and mail-in paper survey modes were offered as response options. Of the 5,600 respondents, about 43% were conducted through in-person interviews, 37% through online questionnaires, and 20% through mail-in paper surveys.
Household characteristics summary tables, including data about the types of fuels used and equipment installed in households, are the first in a series of data releases from the 2015 RECS. A microdata file with household-level data, which allows more detailed analysis than the summary tables provide, is scheduled for release in April 2017.
As part of the RECS, EIA also collects energy billing data from utilities and other household energy suppliers. These data are used to estimate aggregate household energy consumption and expenditures, as well as to disaggregate household energy use into specific end-uses such as heating, cooling, water heating, and refrigeration. EIA plans to release these RECS Consumption and Expenditures estimates beginning early 2018.
Principal contributors: Chip Berry, Maggie Woodward