Sulfur dioxide emissions from U.S. power plants have fallen faster than coal generation
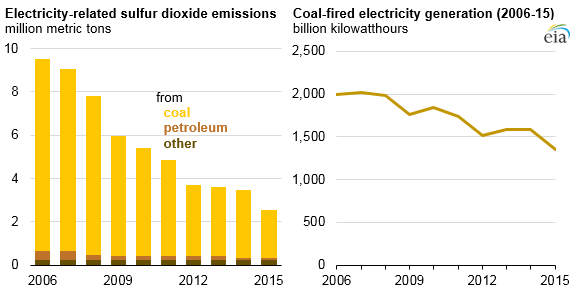
Sulfur dioxide (SO2) emissions produced in the generation of electricity at power plants in the United States declined by 73% from 2006 to 2015, a much larger reduction than the 32% decrease in coal-fired electricity generation over that period. From 2014 to 2015, the most recent year with complete power plant emissions data, SO2 emissions fell 26%—the largest annual drop in percentage terms in the previous decade. Nearly all electricity-related SO2 emissions are associated with coal-fired generation.
Several factors have contributed to lower SO2 emissions:
Changes in the electricity generation mix. Electricity generation from coal fell 14% from 2014 to 2015. This drop was mostly offset by an increase in electricity generation from natural gas, but because natural gas has only trace amounts of sulfur, the net effect resulted in fewer SO2 emissions.
Installation of environmental equipment. To comply with the federal Mercury and Air Toxics (MATS) rule, several coal and oil-fired plants installed pollution control equipment. Plants had to comply by April 15, 2015, or for some plants that received one-year extensions, by April 15, 2016. Two types of pollution control technologies installed for MATS compliance that also reduced SO2 emissions are dry sorbet injection systems (DSI) and flue gas desulfurization (FGD) systems, also known as scrubbers. Between December 2014 and April 2016, DSI systems were installed on 15 gigawatts of coal capacity, and FGD scrubbers were installed on 12 GW of coal capacity. During 2015, these plants burned 18% less coal than in 2014 and reduced their SO2 emissions by 49%.
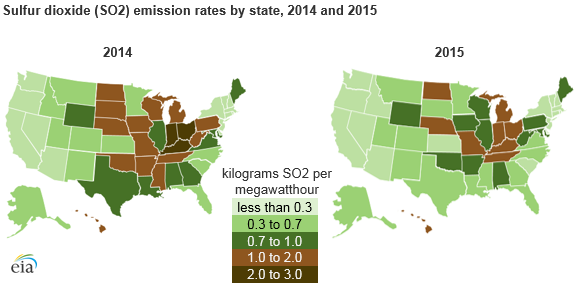
Lower utilization of the most-polluting plants. Different coal-fired plants produce SO2 at different rates. Plants that produce more than two metric tons of SO2 per million kilowatthours of electricity generation were used less often in 2015.
Ohio, Indiana, and Kentucky had the highest SO2 emissions rates in 2014, but each state experienced substantial decreases in 2015. These states were among the top five states to retire coal capacity during 2015, collectively retiring more than one-third of all retired coal-fired capacity in 2015.
Principal contributors: Jonathan DeVilbiss, Suparna Ray