U.S. Energy Information Administration logo
Skip to sub-navigation
September 6, 2011

Market Watch: Tropical Storm Lee combined with reduced holiday loads cut natural gas and electricity consumption over the weekend. It also forced Gulf of America production shut-ins, 61% for crude oil and 46% for natural gas, according to the Bureau of Ocean Energy Management, Regulation and Enforcement (BOEMRE). Use this link to monitor developments related to oil and natural gas shut-ins.

Crude oil-directed weekly rig count surpassed 1,000
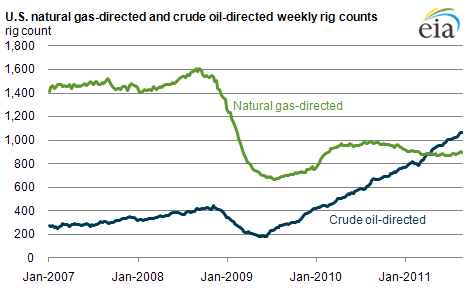
graph of U.S. natural gas-directed and crude oil-directed weekly rig counts, as described in the article text
Source: U.S. Energy Information Administration based on Baker Hughes weekly rig count data.

Since surpassing the weekly count of natural gas-directed rigs on April 21, the number of oil-directed rigs continued to increase steadily through August. On June 24, 2011, the Baker Hughes weekly count of rigs actively drilling for oil in the United States was 1,003, marking the first week since the company began separating oil and natural gas rig counts in 1987 that the 1,000 count threshold for oil-targeted rigs was surpassed. The weekly count reached 1,069 in the report released on August 26.

The rig count is an important indicator of exploration and development activity for both oil and natural gas. Historically, drilling for each resource has tracked price changes, although with some lag. Currently, the high price of crude oil compared to natural gas, the crude oil-to-natural gas price ratio, encourages operators to drill for oil in preference to natural gas. It also makes natural gas liquids developments more commercially attractive.

The August 17 This Week in Petroleum provides a more detail discussion on recent trends in oil-directed rigs.

Statistics
Analysis
Tools
Education
News

Petroleum & Other Liquids

Crude oil, gasoline, heating oil, diesel, propane, and other liquids including biofuels and natural gas liquids.

Natural Gas

Exploration and reserves, storage, imports and exports, production, prices, sales.

Electricity

Sales, revenue and prices, power plants, fuel use, stocks, generation, trade, demand & emissions.

Coal

Reserves, production, prices, employment and productivity, distribution, stocks, imports and exports.

Nuclear & Uranium

Uranium fuel, nuclear reactors, generation, spent fuel.

Renewable & Alternative Fuels

Includes hydropower, solar, wind, geothermal, biomass and ethanol.

EIA Survey Forms

Forms EIA uses to collect energy data including descriptions, links to survey instructions, and additional information.

Total Energy

Comprehensive data summaries, comparisons, analysis, and projections integrated across all energy sources.

U.S. States

State energy information, including overviews, rankings, data, and analyses.

International

International energy information, including overviews, rankings, data, and analyses.

Environment

Greenhouse gas data, voluntary reporting, electric power plant emissions.

Data Tools, Apps, & Maps

Tools to customize searches, view specific data sets, study detailed documentation, and access time-series data.

Open Data

EIA's free and open data available as API, Excel add-in, bulk files, and widgets

EIA Beta

Come test out some of the products still in development and let us know what you think!

Open Source Code

EIA's open source code, available on GitHub.

RSS Feeds

Subscribe to feeds for updates on EIA products including Today in Energy and What's New.