Energy commodity prices rose more than other commodity sectors in 2016
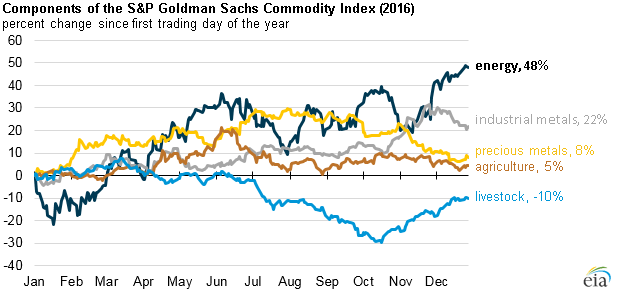
Note: S&P GSCI indices shown in the chart are spot return indices, which only reflect levels of futures contracts included in the index.
The spot energy index in the S&P Goldman Sachs Commodity Index (GSCI) rose 48% since the start of 2016, more than any other commodity group in the S&P GSCI. The spot S&P GSCI industrial metals, precious metals, and agriculture indices increased less, rising 22%, 8%, and 5%, respectively, while the spot S&P GSCI livestock index declined 10%. Among individual commodities, zinc, natural gas, crude oil, and diesel saw larger percentage increases than all other commodities in the S&P GSCI. Commodity price movements were influenced by global economic growth as well as by commodity-specific supply-side factors in 2016.
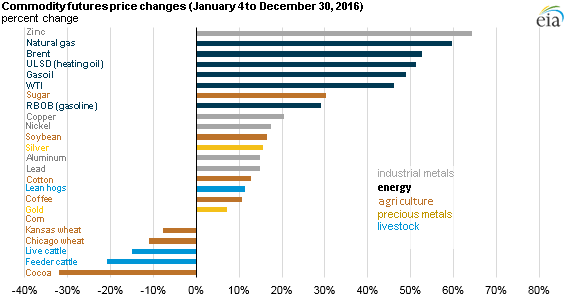
Note: The 24 commodities in the graph comprise the S&P GSCI. All price changes reflect changes in front month futures contract price for each commodity. WTI is West Texas Intermediate, RBOB is reformulated gasoline blendstock for oxygenate blending, and ULSD is ultra-low sulfur diesel.
West Texas Intermediate (WTI) and Brent, two major crude oil benchmarks, account for 69% of the weighting in the S&P GSCI energy index. As a result, the energy index tends to follow major price movements in the crude oil market. After two years of significant price declines, crude oil prices rose from the 13-year lows set in January and February 2016. With declines in crude oil production in the United States, China, Canada, and Venezuela, global liquid fuels inventory growth slowed in 2016 compared with 2015. Since May, crude oil prices have generally remained between $40 per barrel (b) and the low $50/b range. Crude oil prices rose to their highest points in 2016 during December after the Organization of the Petroleum Exporting Countries (OPEC) and non-OPEC countries announced agreements to cut crude oil production beginning in 2017. In addition, improved economic growth in both developed and emerging markets supported crude oil prices.
Petroleum-based products such as reformulated gasoline blendstock for oxygenate blending (RBOB), ultra-low sulfur diesel (ULSD), and gasoil comprise 26% of the S&P GSCI energy index. RBOB had the smallest price increase among energy commodities, as gasoline stocks rose to a record high earlier in 2016 after refineries increased gasoline production yields. However, growth in U.S. gasoline consumption and record high U.S. gasoline exports helped to draw down gasoline inventories and to provide some price support in the last few months of 2016. Lower distillate production helped stabilize distillate inventory levels in 2016 after distillate stocks rose significantly in 2015. In addition, expanding manufacturing sectors in several regions in the world contributed to higher distillate consumption and supported ULSD and gasoil prices in 2016.
Natural gas accounts for the remaining 5% of the S&P GSCI energy index, and it experienced the largest percentage increase in price among energy commodities in 2016. High levels of natural gas storage at the start of the 2015–16 winter, together with warm winter weather that kept withdrawals below seasonal norms, translated into very low natural gas prices at the start of 2016. Natural gas prices increased rapidly in the second half of 2016 because of record natural gas-fired electricity generation in the summer of 2016 and expectations that the 2016–17 winter would be significantly colder than the previous winter.
The S&P GSCI industrial metals index, weighted mainly towards copper and aluminum, increased in 2016 for the first time since 2012. The S&P GSCI precious metals index, composed of gold and silver, increased in the first half of 2016 but gradually declined in the second half of the year. Commodity price movements within the S&P GSCI agriculture index were generally mixed, with prices for sugar, soybeans, coffee, and cotton rising, while the remaining agriculture commodity prices declined or remained stable. The S&P GSCI livestock index, which consists of cattle and lean hog commodities, declined to a seven-year low in October 2016.
Principal contributor: Rebecca George
Tags: diesel, gasoline, liquid fuels, natural gas, oil/petroleum, prices