In 2015, U.S. coal production, consumption, and employment fell by more than 10%
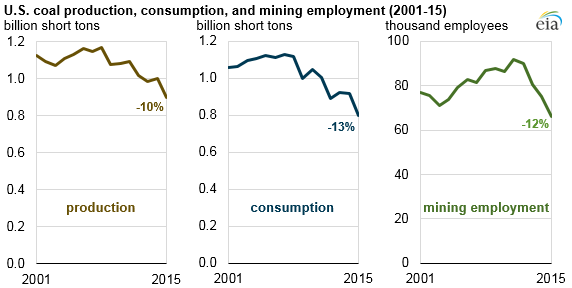
U.S. coal production dropped by more than 10% in 2015 to 897 million short tons (MMst), the lowest production level since 1986. Production in all three major coal-producing regions (the Appalachian, the Interior, and the Western) declined, as consumption of coal for electric power generation, industrial, and other uses fell by 13% to 798 MMst in 2015. Employment at U.S. coal mines fell 12% to about 66,000 employees in 2015, the lowest level since EIA began collecting coal mining employment data in 1978. The declining trend has continued into 2016 as indicated by the most recent weekly coal production data: U.S. year-to-date coal production as of October 29, 2016, totaled approximately 607 MMst, 20% lower than the comparable year-to-date coal production in 2015.
EIA’s Annual Coal Report compiles annual data on several coal metrics such as production, consumption, stocks, prices, trade, and employment. For several reasons, including increased competition from natural gas and more stringent state and federal environmental regulations, the use and production of coal has declined in recent years. Highlights from the Annual Coal Report are included below.
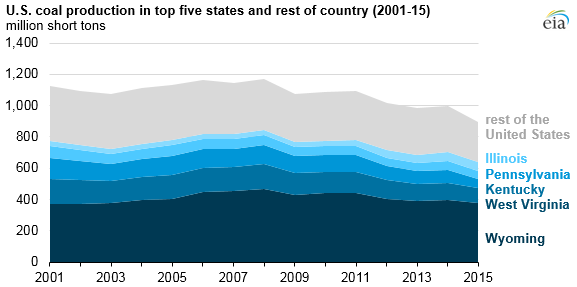
The Appalachian region’s coal production in 2015 was 221 MMst, the lowest level since 1978. Coal production in Kentucky and West Virginia fell 21% and 15%, respectively, from 2014.
The Interior region’s coal production declined for the first time in six years, falling to 167.4 MMst, 11% lower than in 2014. Illinois, the largest coal-producing state in the region, declined by 3.2% to 56.1 MMst.
The Western region's coal production in 2015 decreased by 35.4 MMst to 507.4 MMst. In Wyoming, the largest coal-producing state in the United States, coal production decreased by 15.4 MMst to 375.7 MMst, the lowest level since 2002. Montana’s production was 41.9 MMst, 6.1% lower than in 2014.
Total U.S. coal consumption in 2015 was 798 MMst, a decrease of 13% from 2014 and the lowest level since 1986. Power sector coal consumption fell in part because of increased competition from natural gas-fired and renewable electricity generation. Coal consumption in the industrial, coke, and commercial and institutional sectors was 58.6 MMst in 2015, a 9% decrease from 2014. Coal consumption so far in 2016 is also declining, similar to the trend in coal production. Data for the first seven months of 2016 indicate that U.S. total coal consumption is 23% lower in 2016 than in the first seven months of 2015.
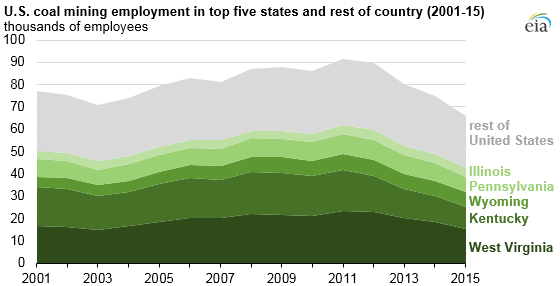
Employment at U.S. coal mines in 2015 decreased by 12% to 65,971 employees. West Virginia and Kentucky had the largest declines in the average number of employees in 2015, decreasing by 2,840 (16%) and 2,013 employees (17%), respectively. Although there were fewer coal mine employees in the United States in 2015 than in 2014, the average production per employee-hour increased slightly to 6.3 short tons per employee-hour.
Principal contributor: Brian Park