Menu
Crude oil, gasoline, heating oil, diesel, propane, and other liquids including biofuels and natural gas liquids.
Exploration and reserves, storage, imports and exports, production, prices, sales.
Sales, revenue and prices, power plants, fuel use, stocks, generation, trade, demand & emissions.
Energy use in homes, commercial buildings, manufacturing, and transportation.
Reserves, production, prices, employment and productivity, distribution, stocks, imports and exports.
Includes hydropower, solar, wind, geothermal, biomass and ethanol.
Uranium fuel, nuclear reactors, generation, spent fuel.
Comprehensive data summaries, comparisons, analysis, and projections integrated across all energy sources.
Monthly and yearly energy forecasts, analysis of energy topics, financial analysis, congressional reports.
Financial market analysis and financial data for major energy companies.
Greenhouse gas data, voluntary reporting, electric power plant emissions.
Maps, tools, and resources related to energy disruptions and infrastructure.
State energy information, including overviews, rankings, data, and analyses.
Maps by energy source and topic, includes forecast maps.
International energy information, including overviews, rankings, data, and analyses.
Regional energy information including dashboards, maps, data, and analyses.
Tools to customize searches, view specific data sets, study detailed documentation, and access time-series data.
EIA's free and open data available as API, Excel add-in, bulk files, and widgets
Come test out some of the products still in development and let us know what you think!
EIA's open source code, available on GitHub.
Forms EIA uses to collect energy data including descriptions, links to survey instructions, and additional information.
Sign up for email subscriptions to receive messages about specific EIA products
Subscribe to feeds for updates on EIA products including Today in Energy and What's New.
Short, timely articles with graphics on energy, facts, issues, and trends.
Lesson plans, science fair experiments, field trips, teacher guide, and career corner.
EIA is continuing normal publication schedules and data collection until further notice.
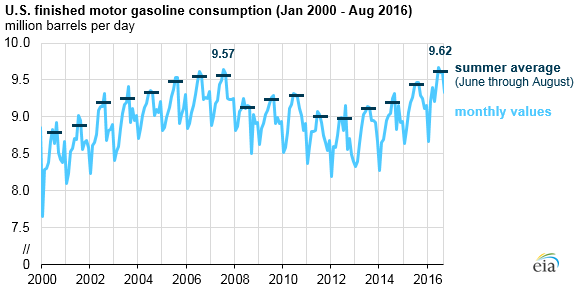
The consumption of U.S. finished motor gasoline reached a new high of 9.7 million barrels per day (b/d) in June 2016, surpassing the previous one-month high of 9.6 million b/d set in July 2007. U.S. gasoline consumption during summer 2016 (June through August) increased by 169,000 b/d, or 1.8%, relative to the same period in 2015. The increase in gasoline consumption was slightly lower than the increase in driving, suggesting that fuel economy improvements slightly mitigated the increase.
Vehicle miles traveled (VMT) were also high in summer 2016, setting a new record in June. From summer 2015 to summer 2016, VMT grew to 9.3 billion miles per day, an increase of nearly 3.0%. This is slightly more than the 1.8% growth in gasoline consumption over that period. Compared to summer 2007, summer 2016 VMT increased more than 6.4%, while gasoline consumption only increased 0.5%.
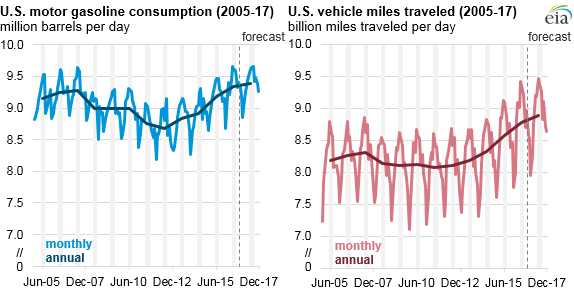
The October Short-Term Energy Outlook forecasts an annual gasoline consumption increase of 0.5% from 2016 to 2017, based on a 1.3% increase in travel and improvements in fuel economy.
Principal contributor: Matthew French
Tags: consumption/demand, gasoline, liquid fuels