Winter heating bills likely to increase, but still remain below recent winters
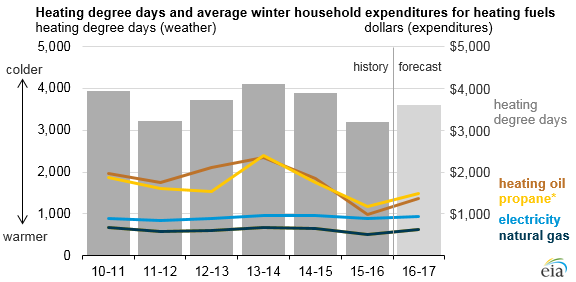
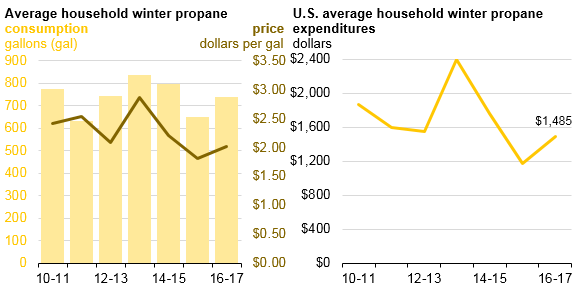
Note: The propane price is a weighted average of Midwest and Northeast prices.
Most U.S. households can expect higher heating expenditures this winter (October through March) compared to last winter, according to EIA's Winter Fuels Outlook. Winter heating expenditures for most fuels were especially low last winter, when energy prices were relatively low and warm weather reduced heating demand to the lowest level nationally in at least 25 years. Although expenditures for nonelectric fuels are expected to be higher than last winter, expenditures are comparable to or lower than the average winters from 2010–11 through 2014–15. By comparison, electric heating prices and expenditures are expected to remain relatively stable.
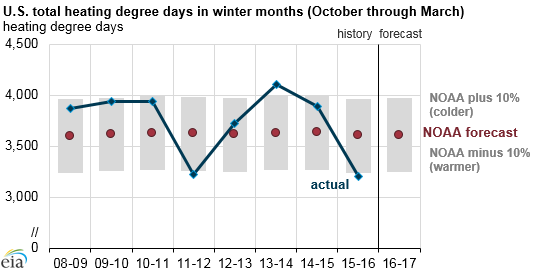
Winter heating expenditures are a function of expected fuel prices and demand for heating. EIA’s projections of heating demand are based on the most recent temperature forecasts from the National Oceanic and Atmospheric Administration (NOAA), which reflect weather that would be 13% colder than last winter but about 3% warmer than the previous 10-year average. Because weather patterns present great uncertainty to winter energy forecasts, EIA's Winter Fuels Outlook includes projections for 10% colder and 10% warmer scenarios. In the past five winters, actual temperatures have been more than 10% colder than NOAA’s September forecast once and more than 10% warmer than forecast twice.
The average household winter heating fuel expenditures in EIA’s forecast provide a broad guide to expected heating expenditures. Fuel expenditures for each household are highly dependent on the size and energy efficiency of individual homes and their heating equipment, indoor temperature preferences, and local weather conditions.
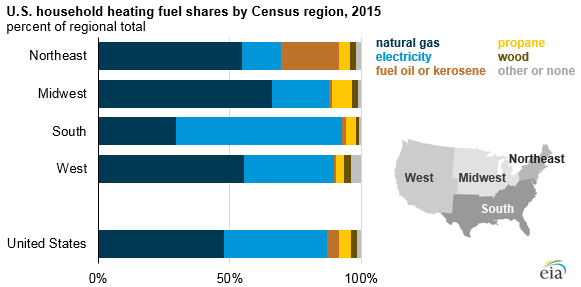
The choice of primary heating fuel varies considerably by region, resulting in regional differences in total expenditures. Natural gas is the most common space heating fuel in every region except the South, where electric heating is more prevalent. Heating oil is much more common in the Northeast than in other regions, while propane is more common in the Midwest.
Summaries of the winter outlook for individual fuels are provided below:
Source: U.S. Energy Information Administration, Short-Term Energy Outlook, Winter Fuels Outlook, October 2016
Note: Winter covers the period October 1 through March 31.
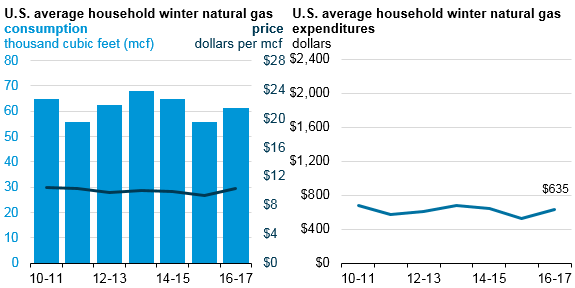
Almost half of U.S. households use natural gas as their primary heating fuel. EIA expects households heating with natural gas to spend an average of $635 this winter, which would be 22% higher than last winter but nearly equal to the average expenditures for the five winters prior to last winter (2010–11 through 2014–15). EIA projects natural gas inventories will total 3,966 billion cubic feet (Bcf) at the end of October, which would be near a record high going into the heating season.
Source: U.S. Energy Information Administration, Short-Term Energy Outlook, Winter Fuels Outlook, October 2016
Note: Winter covers the period October 1 through March 31.
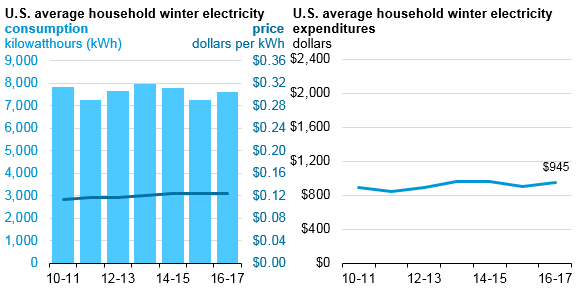
About 39% of all U.S. households rely primarily on electric heating, ranging from 15% of households in the Northeast to 63% in the South. Households heating with electricity are expected to spend an average of $945 on electricity this winter, which would be 5% higher than last winter and 2% higher than average expenditures in the five winters prior to last winter (2010–11 through 2014–15). Residential electricity prices are expected to be about the same as last winter, and heating use is expected to be 5% higher.
Source: U.S. Energy Information Administration, Short-Term Energy Outlook, Winter Fuels Outlook, October 2016
Note: Winter covers the period October 1 through March 31.
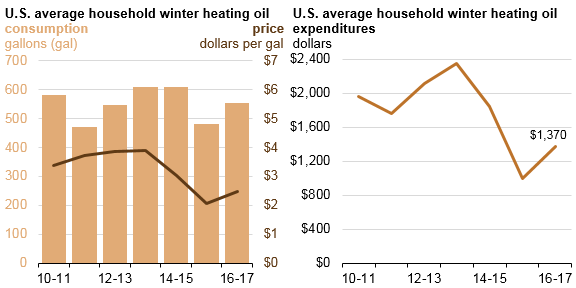
About 22% of the households in the Northeast and 5% of households nationally use heating oil as their primary heating fuel. EIA expects households heating with heating oil to spend an average of $1,370, which would be 38% higher than last winter but 32% lower than average expenditures for the five winters prior to last winter (2010–11 through 2014–15). Distillate fuel (including heating oil) storage inventories in the Northeast totaled 52.3 million barrels on September 30, which is nearly 7.0 million barrels higher than at the same time last year and close to the highest level for any week since late 2010.
Source: U.S. Energy Information Administration, Short-Term Energy Outlook, Winter Fuels Outlook, October 2016
Note: Winter covers the period October 1 through March 31.
Nearly 5% of all U.S. households heat with propane. EIA expects that households heating with propane will spend an average of $1,485 this winter, which would be 26% higher than last winter but 18% lower than average expenditures for the five winters prior to last winter (2010–11 through 2014–15). U.S. propane inventories reached 104 million barrels as of September 30, almost 4 million barrels higher than at the same time last year. Inventories have remained above the previous five-year range for the past two years.
Nearly 2.5 million households used wood as their primary residential space heating fuel in 2015, which represents a 26% increase since 2005. About 8% of households use wood as a secondary source of heat, making wood second only to electricity as a supplemental heating fuel. Unlike the other home heating fuels, there are no readily available sources for estimating wood consumption or prices at the regional or national level. EIA will collect additional wood consumption data in the next Residential Energy Consumption Survey.
Principal contributor: Stacy MacIntyre