Hurricane Matthew may cause problems for East Coast energy infrastructure
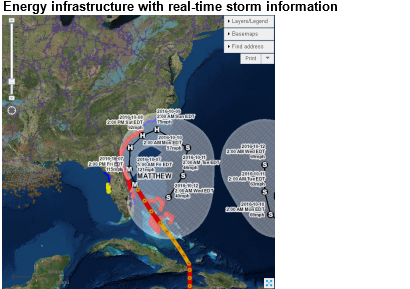
Hurricane Matthew is moving near or over the east coast of Florida as a Category 3 storm Friday morning. The storm is on track to move north along the East Coast as far as North Carolina this weekend, potentially bringing torrential rainfall, storm surges, and flooding to the region. To help analysts assess energy-related potential storm effects, EIA maintains an energy disruptions map that displays energy infrastructure and real-time storm information.
Because of the storm's proximity to the coast, high winds, rainfall, and flooding will potentially affect electricity infrastructure such as power transmission and distribution lines. Thousands of customers are already without power. Although there are no petroleum refineries or natural gas processing plants along the East Coast from Florida to Maryland, some product terminals could be affected, potentially reducing energy imports. Governors in Florida, North Carolina, South Carolina, and Georgia have declared states of emergency in advance of the storm's arrival.
It has been more than a decade since a hurricane rated Category 3 or higher has made landfall in the United States. Hurricane Sandy, the last major hurricane to affect this region, was a Category 1 storm by the time it made landfall in New Jersey in October 2012. Hurricane Sandy had major impacts on energy infrastructure, as downed power lines and flooded electric substations contributed to more than eight million customers losing power. Fuel distribution networks and crude oil and petroleum product terminals were damaged, and the lack of electricity caused many service stations to be unable to provide gasoline.
EIA's energy disruptions map displays key layers of energy infrastructure, including oil refineries, power plants, and major electric transmission lines, and real-time storm information from the National Weather Service. The disruption map page also contains links to the U.S. Department of Energy's Emergency Situation Reports and other websites that provide updates on the effect of severe weather on energy infrastructure. GasBuddy, a retail gasoline price comparison site, maintains a crowd-sourced tracking tool to determine fuel availability at thousands of retail stations in the Southeast.
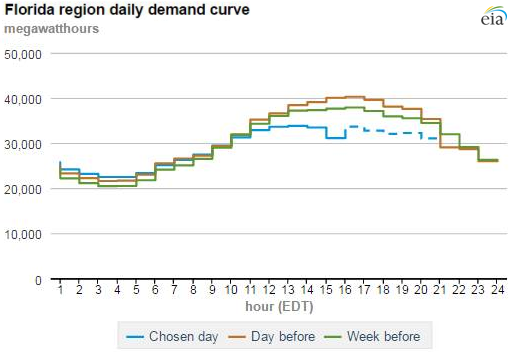
EIA's U.S. Electric System Operating Data tool provides near real-time information on electricity demand and can show areas where service has been disrupted. On Thursday, electricity demand in parts of Florida was lower than forecast as the weather worsened and customers evacuated the area.
Principal contributor: EIA Staff
Tags: distribution, Florida, map, states, weather