
Clean Power Plan reduces projected coal production in all major U.S. supply regions
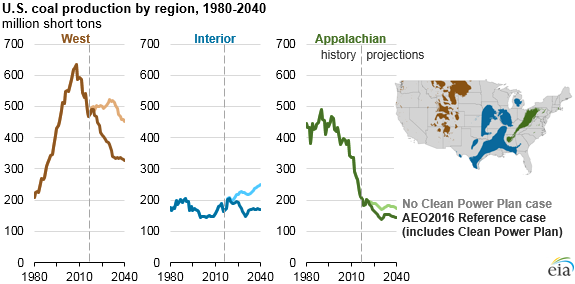
U.S. coal production is projected to decline by about 26%, or 230 million tons, between 2015 and 2040 in EIA's Annual Energy Outlook 2016 (AEO2016) Reference case, which assumes the implementation of the Clean Power Plan (CPP). In a scenario that assumes the CPP is never implemented (No CPP case), U.S. coal production remains close to 2015 levels through 2040. Although production in each major U.S. coal supply region is expected to decline when the CPP is implemented, the magnitude of the effects differs because of differences in coal quality, pricing, and the markets served by each region.
In 2015, the coal production shares of the West, Interior, and Appalachian regions were 55%, 19%, and 26%, respectively. In the scenario without the Clean Power Plan, these shares were expected to shift to 52%, 29%, and 20% by 2040, respectively, as coal production from the Interior region increases while coal production in the West and Appalachian regions decreases. In the Reference case, the decline in coal demand impedes growth for the Interior region and leads to even larger declines in the West and Appalachian regions. By 2040, market shares for the West, Interior, and Appalachian regions are 51%, 26%, 22%, respectively.
West. Coal production in the West region falls by 155 million tons between 2015 and 2040 in the Reference case, compared to a reduction of 31 million tons in the No CPP case. Approximately two-thirds of Western coal production occurs in the Powder River Basin, where relatively low mining costs and low-sulfur coal have offset higher transportation costs and allowed western coal to remain economic in distant markets.
However, the addition of sulfur control equipment at existing coal-fired power plants to accommodate the Mercury and Air Toxics Standards (MATS) early in the projection period makes higher sulfur coals more competitive at units that had previously used low-sulfur coal to comply with prior limitations on sulfur dioxide emissions. In the Reference case, competition from natural gas and renewables combined with coal-fired power plant retirements also lowers coal demand in the states that are currently large consumers of Western coal.
Interior. Coal production in the Interior region increases by 86 million tons by 2040 in the No CPP case. In the Reference case, this increase is smaller, totaling 5 million tons by 2040. Over the projection period, coal producers in the region are projected to control costs using longwall mining, a technique that is well-suited for the region's coal reserves. Additionally, the installation of sulfur control equipment at existing coal-fired power plants will enable Interior coal to displace some use of lower-sulfur Western and Appalachian coals.
Appalachian. Coal production in the Appalachian region, which has declined steeply over 2000-2015, is projected to see the smallest reduction in production attributable to the CPP. In the No CPP case, Appalachian coal declines 50 million tons by 2040. In the Reference case, Appalachian coal declines 79 million tons. Appalachian steam coal production is relatively expensive relative to other coals, and it is expected to experience decreasing labor productivity. This lower productivity further decreases its competitiveness with coal from other regions, as well as with other fuels used to generate electricity, such as natural gas. However, production of metallurgical coal, which is used in the steelmaking process, represented about 28% of the region's total coal production in 2014 and is not affected directly by the CPP. However, slower growth in international metallurgical coal demand and falling international steam coal trade also limit projected export growth for Appalachian coal.
Principal contributor: Diane Kearney
Tags: AEO (Annual Energy Outlook), AEO2016, coal, standards