
Clean Power Plan implementation choices by states could affect electricity generation mix
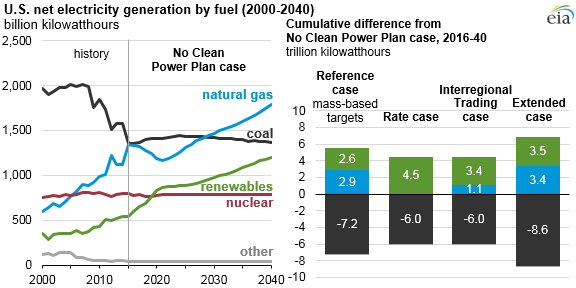
In designing the Clean Power Plan, the U.S. Environmental Protection Agency provided states with implementation flexibility. Given the options available to states, EIA has produced several scenarios as part of an Issues in Focus analysis in the Annual Energy Outlook 2016 (AEO2016). Differences in emissions target types, emissions trading markets, and policy timelines have implications for electric capacity and generation in the United States.
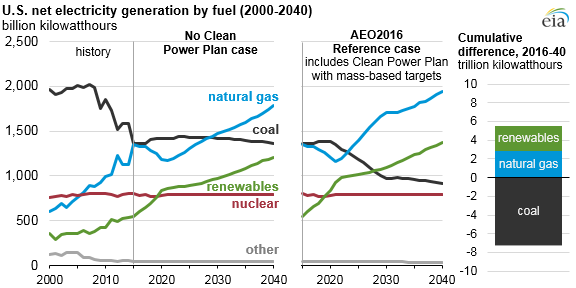
The Clean Power Plan (CPP) scenarios tend to result in more electricity generation from renewables—especially solar and wind—and (in most cases) natural gas over the next 25 years compared with projections without the CPP (No CPP case). In all cases, coal generation declines, and generation from other fuels such as nuclear or hydroelectricity are relatively unchanged. Power-sector carbon dioxide emissions are lower and retail electricity prices are higher compared with a case without the CPP.
Source: U.S. Energy Information Administration, Annual Energy Outlook 2016
In the AEO2016 Reference case, states comply with mass-based standards during the CPP compliance period from 2022 through 2030, and maintain the 2030 standard through 2040. Mass-based standards limit the absolute levels of carbon dioxide (CO2) collectively emitted from a state's electricity generators. In the mass-based Reference case scenario, a state's total emissions are essentially constrained, as fossil-fueled generators compete among each other for emissions allowances. Previous Today in Energy articles have examined the Reference case assumptions on regional electricity generation, coal production, and CO2 emissions.
Source: U.S. Energy Information Administration, Annual Energy Outlook 2016
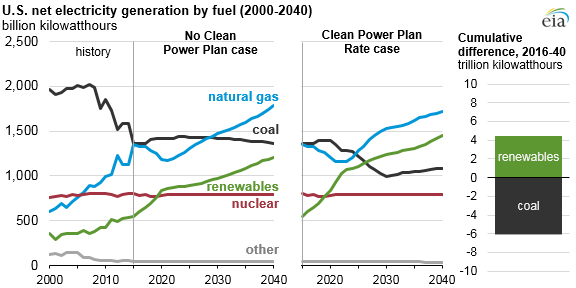
In the Clean Power Plan Rate case, states comply with rate-based standards to limit the amount of CO2 collectively emitted per unit of electricity generation. The rate is calculated as the emissions from existing fossil units divided by generation from existing fossil units plus generation from new builds of zero-carbon technologies and incremental demand-side energy efficiency. Compared to the mass-based Reference case, renewable generation is higher while natural gas use is lower. The CPP Rate case allows some increase in coal generation in later years as long as there is sufficient zero-carbon generation to offset the increased emissions associated with coal generation.
Source: U.S. Energy Information Administration, Annual Energy Outlook 2016
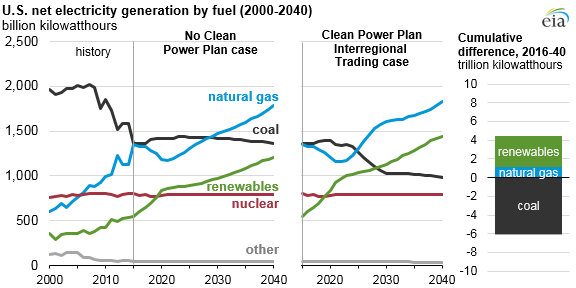
The Clean Power Plan Interregional Trading case assumes increased cooperation of states in achieving their targets through reliance on allowance markets. Because the availability and cost of renewable energy resources vary significantly across the country, greater allowance trading enables regions with low-cost renewable resources to effectively over-comply and sell excess emissions allowances to regions with relatively high-cost renewable resources. In this case, renewables are also higher than in the Reference case. Because states with existing coal capacity may purchase emissions allowances from other states, slightly less coal capacity is retired and coal-fired generation is higher than Reference case levels.
Source: U.S. Energy Information Administration, Annual Energy Outlook 2016
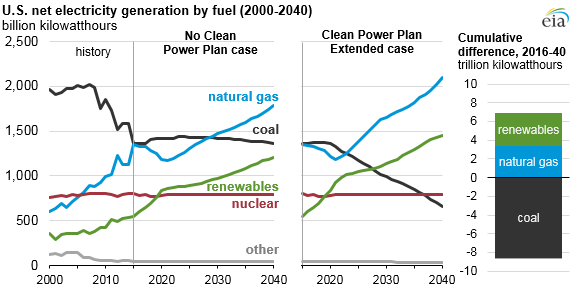
The Clean Power Plan Extended case is similar to the Reference case assumptions, except the mass-based emissions targets become increasingly stringent after 2030. The electricity generation mix is largely similar to the Reference case through 2030. After 2030, as electricity demand grows and fewer emissions are allowed, coal's share of generation falls from 21% in 2030 to 13% in 2040, offset by growth in renewables and natural gas.
Although demand-side energy efficiency plays a major role in holding down growth in electricity demand in all AEO2016 cases, incremental efficiency plays a relatively minor role in CPP compliance in all cases. Incremental efficiency reduces 2030 electricity demand by about 67 billion kilowatthours (kWh) to 76 billion kWh, or about 1.5% to 1.7% of total electricity demand, compared with a scenario without the Clean Power Plan.
Principal contributors: Laura Martin, Thad Huetteman