Recent data show divergent trends for rail shipments of crude oil, ethanol, and biodiesel
Although pipelines, tankers, and barges are widely used to transport liquid fuels to, from, and within the United States, several types of liquid fuels, including crude oil, ethanol, and biodiesel, are transported by rail in large volumes. EIA recently expanded its rail data for crude oil, ethanol, and biodiesel to provide monthly data going back to January 2010. The data cover rail movements within each Petroleum Administration for Defense District (intra-PADD) and between PADDs (inter-PADD), as well as rail movements to and from Canada. The expanded rail data improve EIA's regional supply and disposition balances by providing information about both shipments and receipts of these fuels by rail.
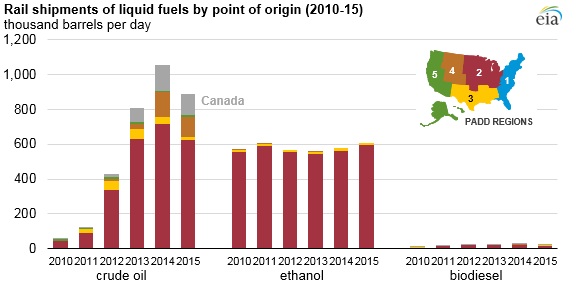
Most crude oil, ethanol, and biodiesel rail shipments in the United States originate in the Midwest (PADD 2) . For ethanol and biodiesel, the volume of each fuel transported by rail aligns with production volumes, as rail is the primary mode used to transport these fuels.
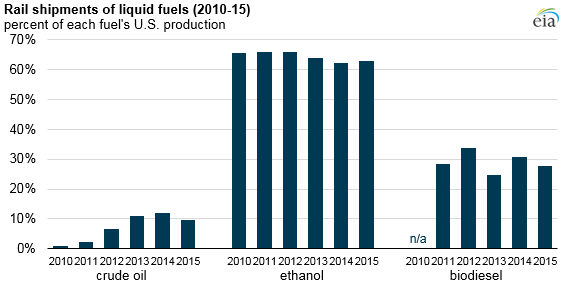
Although crude oil is primarily transported through pipelines, the amount of crude oil shipped by rail had increased from 2010 to 2014 as domestic crude oil production exceeded pipeline takeaway capacity for crude oil. The volume of crude oil transported by rail depends on many factors, including production volumes, price differences across crude oil types, netback value to the wellhead from alternative destination points, and availability of pipeline infrastructure. After reaching more than one million barrels per day in 2014, crude-by-rail volumes declined slightly in 2015.
The origins, destinations, and volumes of ethanol and biodiesel shipped by rail have not changed much over the past six years. Almost all ethanol and biodiesel ends up in the motor gasoline or diesel pools, respectively. The only other outlet for fuel ethanol or biodiesel is exports, which are relatively small compared with domestic consumption, making up 6% and 7% of the total ethanol and biodiesel volumes produced in 2015, respectively.
In 2015, the ethanol share of gasoline was 9.9%, and the biodiesel share of distillate was 2.4%. In 2015, the Midwest shipped 594,000 barrels per day (b/d) of ethanol by rail and 17,000 b/d of biodiesel by rail. The East Coast (PADD 1) receives almost half of the ethanol shipped by rail. The volume of ethanol shipped by rail will likely change if more ethanol is blended into gasoline, but ethanol's share of the gasoline pool has been relatively steady at just below 10%.
Taken together, rail movements of crude oil, ethanol, and biodiesel in the first three months of 2016 averaged 1.1 million b/d, 19% lower than the 2013–15 average. Ethanol and biodiesel rail shipments have been relatively flat, so the recent overall decline in transport of liquid fuels by rail reflects reduced rail shipments of crude oil.
Principal contributor: Arup Mallik
Tags: biofuels, crude oil, ethanol, liquid fuels, rail