Hydropower conditions improve as West Coast drought eases
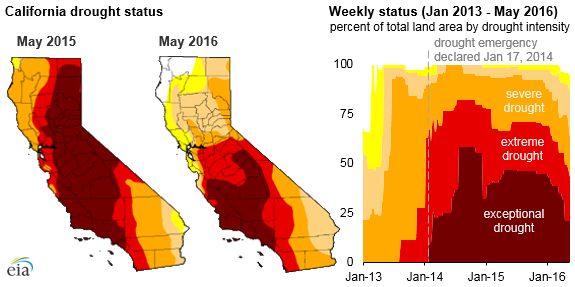
The western United States, particularly California, has experienced drought over the past several years, but there are now signs of improvement. Since June 2013, most of California has been in a severe, extreme, or exceptional drought, the worst three drought designations as determined by the U.S. Drought Monitor. By mid-2014, nearly 60% of the state was in the exceptional drought category, and California's governor had declared a drought emergency. The drought led to significant declines in hydroelectric generation throughout the West, and California's first-ever mandatory water restrictions in 2015.
Though far from being back to normal conditions, California's water situation has improved recently. This winter's strong El Niño weather system brought considerable precipitation to much of the West, building the snowpack and helping to fill reservoirs. As of mid-May, 21% of California is in exceptional drought, the lowest percentage since February 2014. More than 5% of the state is now listed as not having any drought, the highest percentage since March 2013.
Snowpack in California is significantly higher than at this time last year, although it is still below long-term average levels. At the end of April, statewide California snowpack water content stood at 14.5 inches, 61% of average and up from a mere 1.1 inches at the same time in 2015. Statewide reservoir levels have also improved considerably. The 10 largest reservoirs in California averaged 66% of capacity and 88% of average on the last day of April, with 4 of the 10 reservoirs higher than average on that date. The improving situation prompted the California State Water Resources Control Board on May 18 to lift last year's statewide conservation order, now allowing local water districts to set their own targets.
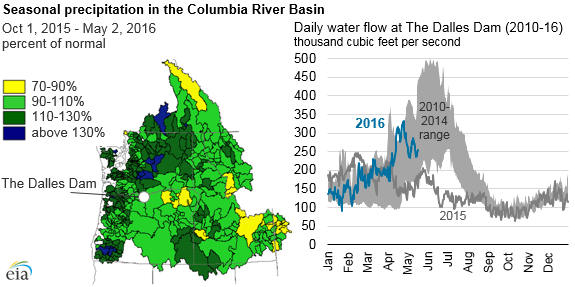
In the Pacific Northwest, seasonal precipitation (for the water year beginning October 1, 2015) in the Columbia River Basin has been relatively high. The Columbia River Basin is home to roughly one-third of U.S. hydroelectric generating capacity and exports a significant amount of electricity to California. As of May 17, all regions within the Columbia River Basin had received at least 70% of normal precipitation, and most had at least 90% of normal.
Water flows, however, depend on both precipitation and the melting of snowpack. Northwest snowpack levels dropped dramatically during April and are now below normal for much of the region. Lower snowpack levels likely will mean lower water flows in late spring and summer. The Dalles Dam is a run-of-river facility on the Columbia River near the northern end of large electricity transmission lines into California. Water flows from The Dalles Dam began to increase in mid-February, approaching and even exceeding the top of the previous six-year range (2010-15), and continued to increase through late April, when warmer-than-normal temperatures melted snow, increasing water flow.
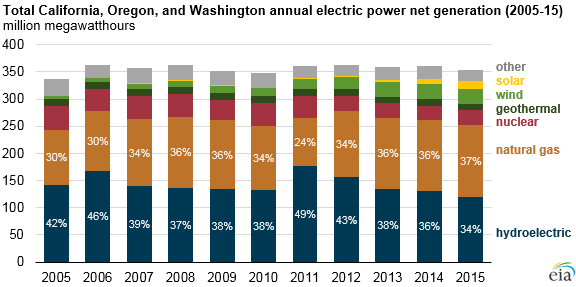
One consequence of the drought in the West has been lower hydroelectric generation across California, Oregon, and Washington, which has fallen each year from 2011 to 2015. In 2015, slightly more than 120 million megawatthours (MWh) came from hydroelectric generators in these three states, down from nearly 177 million MWh generated in 2011. Most of this drop in hydroelectric generation was replaced by natural gas-fired generators, as natural gas became the largest single fuel source for electricity generation across those three states in 2015.
In the Bonneville Power Administration balancing authority region, which covers much of the Northwest, hydroelectric generation started to increase in 2016, with cumulative hydroelectric generation in January through April 2016 higher than the previous five-year average.
Principal contributor: Tim Shear
Tags: California, hydroelectric, map, natural gas, Oregon, states, Washington