August 12, 2011
EIA's SEDS provides detailed data on energy use and expenditures by State
Source: U.S. Energy Information Administration, State Energy Data System.
Download CSV Data
Download CSV Data
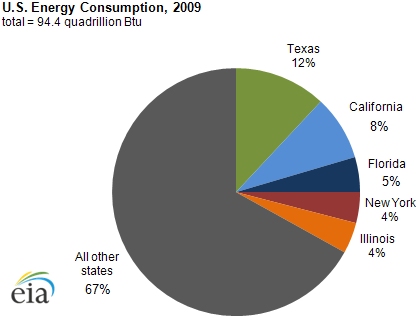
One-third of the energy used in the United States in 2009 was consumed in five States: Texas, California, Florida, New York, and Illinois. EIA's State Energy Data System (SEDS) includes estimates of energy production, consumption, prices, and expenditures broken down by energy source and sector for each of the 50 states. Data from SEDS allows for state-level analysis, and allows users to make comparisons based on energy sources, sectors, and time.
Other findings from the latest SEDS report include:
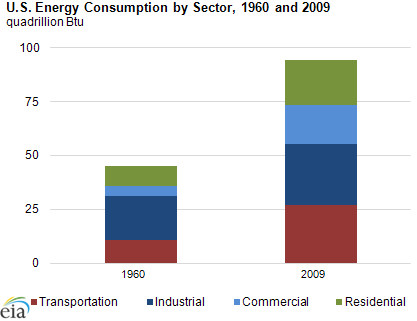
- U.S. energy consumption has more than doubled since 1960, with large amounts of growth in the commercial, transportation, and residential sectors (see bar chart).
- Energy consumption for the industrial sector totaled 28.6 trillion Btu, the most of any sector in 2009.
- At $25.97 per MMBtu, Hawaii has the highest energy prices of all the States; Louisiana has the lowest prices at $11.78 per MMBtu.
- Alaska averages $7,684 per person for energy expenditures, the highest in the Nation; Utah is lowest at $2,646 per person.
Source: U.S. Energy Information Administration, State Energy Data System.
Download CSV Data
Download CSV Data
Further statistics can be found in the full report.
Tags: consumption/demand, states