
Annual passenger travel tends to increase with income
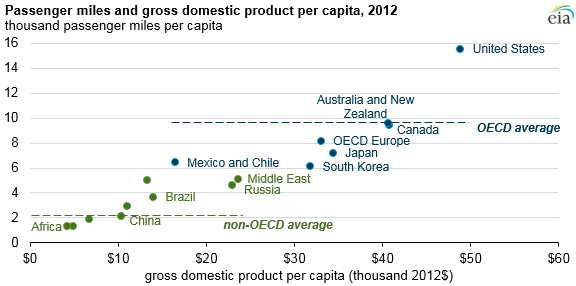
Global passenger travel by light-duty vehicles, bus, rail, and two- and three-wheeled vehicles reached nearly 24 trillion passenger miles in 2012 (the most recent year with detailed international travel statistics). In 2012, the average person traveled 3,300 miles annually, with wide differences across countries that are generally related to differences in per capita income.
The simple global average masks the diversity of passenger travel worldwide: people in countries in the Organization for Economic Cooperation and Development (OECD) travel nearly five times as much as people in non-OECD regions. Even within OECD member countries, travel can vary widely; average annual passenger travel in the United States is double that of the other OECD countries. The passenger-miles metric reflects both the number of passengers and the distance those passengers travel.
In 2012, the 1.2 billion people in OECD countries traveled about 11.0 trillion passenger miles, averaging more than 9,000 miles of travel per person in 2012. The 6 billion people in non-OECD countries traveled about 12.6 trillion passenger miles, averaging slightly more than 2,000 miles of travel per person.
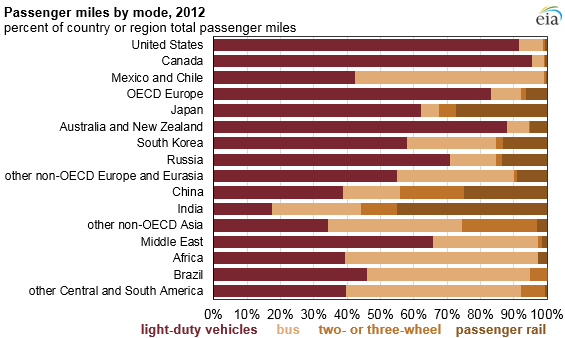
As countries become richer, their populations tend to travel more. The energy-related implications for increased travel largely depend on the mix of transportation modes, which varies substantially between OECD and non-OECD regions. More than 80% of passenger travel in OECD regions was by light-duty vehicles. In contrast, just 41% of non-OECD passenger travel was by light-duty vehicles, with 35% by bus, 14% by rail, and 11% by two- and three-wheeled vehicles.
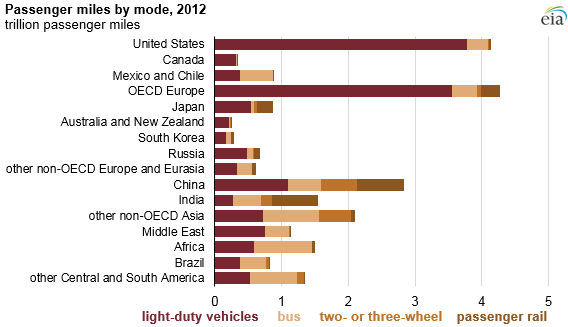
The United States and OECD Europe, each with a relatively high per capita GDP, had the most passenger travel in 2012, with 4.1 and 4.3 trillion passenger miles, respectively. Within the non-OECD regions, China had the most passenger travel, with 2.9 trillion passenger miles. In comparison with the OECD average, China's passenger travel is distributed more evenly between light-duty vehicles, bus, rail, and two- and three-wheeled vehicles. China and India, with large populations and significant passenger rail infrastructure, were the largest users of passenger rail, at approximately 700 billion passenger miles each.
This article is among several international energy-related articles that EIA has produced as part of the 2016 International Energy Outlook.
Principal contributor: Ari Kahan
Tags: international, OECD, transportation, vehicles