U.S. Energy Information Administration logo
Skip to sub-navigation
April 7, 2016

EIA tracks monthly ethanol and biodiesel rail movements
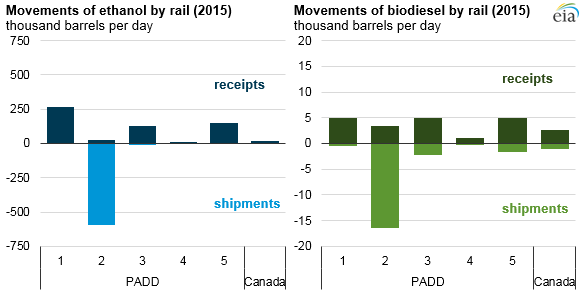
graph of movements of ethanol and biodiesel by rail, as explained in article text
Source: U.S. Energy Information Administration, Petroleum Supply Monthly
Note: Shipments and receipts include intra-PADD movements.

EIA recently released new information on ethanol and biodiesel movements by rail. The new monthly estimates are integrated with EIA's existing Petroleum Supply Monthly and include movements beginning in January 2014. Unlike other liquid fuels that are most commonly transported by pipeline, ethanol and biodiesel are more often transported by rail because both fuels attract water and other impurities in pipelines.

The estimates cover rail movements of ethanol and biodiesel within each Petroleum Administration for Defense District (intra-PADD) and between different PADDs (inter-PADD), as well as rail movements to and from Canada. The estimates improve EIA's regional supply and disposition balances by providing information about both the shipments and receipts of ethanol and biodiesel by rail. Previously, only information on imputed net receipts was available.

Origins, destinations, and volumes of ethanol and biodiesel shipped by rail have not experienced much change over the past two years. Almost all ethanol and biodiesel end up in the motor gasoline or diesel pool, respectively. The only other outlet for fuel ethanol or biodiesel is exports, which are small compared with domestic consumption.

In 2015, the ethanol share of gasoline was 9.9%, and the biodiesel share of distillate was 2.4%. Most ethanol and biodiesel is produced in the Midwest (PADD 2), where it is then shipped to other regions. In 2015, the Midwest shipped 593,000 barrels per day (b/d) of ethanol by rail and 16,000 b/d of biodiesel by rail. The East Coast (PADD 1) receives almost half of the ethanol moved by rail. Biodiesel by rail receipts are about the same in all regions except the Mountain region (PADD 4).

Principal contributor: Arup Mallik

Statistics
Analysis
Tools
Education
News

Petroleum & Other Liquids

Crude oil, gasoline, heating oil, diesel, propane, and other liquids including biofuels and natural gas liquids.

Natural Gas

Exploration and reserves, storage, imports and exports, production, prices, sales.

Electricity

Sales, revenue and prices, power plants, fuel use, stocks, generation, trade, demand & emissions.

Coal

Reserves, production, prices, employment and productivity, distribution, stocks, imports and exports.

Nuclear & Uranium

Uranium fuel, nuclear reactors, generation, spent fuel.

Renewable & Alternative Fuels

Includes hydropower, solar, wind, geothermal, biomass and ethanol.

EIA Survey Forms

Forms EIA uses to collect energy data including descriptions, links to survey instructions, and additional information.

Total Energy

Comprehensive data summaries, comparisons, analysis, and projections integrated across all energy sources.

U.S. States

State energy information, including overviews, rankings, data, and analyses.

International

International energy information, including overviews, rankings, data, and analyses.

Environment

Greenhouse gas data, voluntary reporting, electric power plant emissions.

Data Tools, Apps, & Maps

Tools to customize searches, view specific data sets, study detailed documentation, and access time-series data.

Open Data

EIA's free and open data available as API, Excel add-in, bulk files, and widgets

EIA Beta

Come test out some of the products still in development and let us know what you think!

Open Source Code

EIA's open source code, available on GitHub.

RSS Feeds

Subscribe to feeds for updates on EIA products including Today in Energy and What's New.