U.S. Energy Information Administration logo
Skip to sub-navigation
August 8, 2011

High temperatures drove record electricity demand and very high wholesale prices in Texas
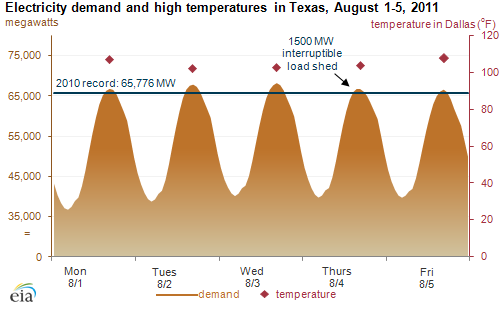
graph of electricity demand and high temperatures in Texas August 1-5, 2011, as described in the article text
Source: U.S. Energy Information Administration based on ERCOT (demand) and NOAA (temperatures) data.
Download CSV Data

Sustained 100°-plus daily high temperatures in Texas last week led to new electric power demand records three days in a row. ERCOT, the electric system operator for most of Texas, set demand records Monday, Tuesday, and Wednesday last week (August 1 - 3, 2011), exceeding the prior record set August 23, 2010 by 2,518 megawatts (MW) (3.8%). On Thursday (August 4, 2011), ERCOT did not break another all-time record, but probably only because they shed 1,500 MW of interruptible demand. To help lower demand, ERCOT also made a number of public appeals for conservation during the week.

A scarcity of generating capacity sent wholesale prices to record levels. Peak hourly day-ahead prices climbed higher each day reaching $2,500 per megawatt hour, more than 50 times the average daily on-peak wholesale prices in ERCOT for the first half of 2011, between 3:00 and 4:00 p.m. on Friday (August 5, 2011) (see chart below). Day-ahead prices are set on the previous day and reflect expected market conditions for the next day. Therefore, the high prices for Friday were set on Thursday when ERCOT had called a supply emergency and temperatures were expected to remain high on Friday.
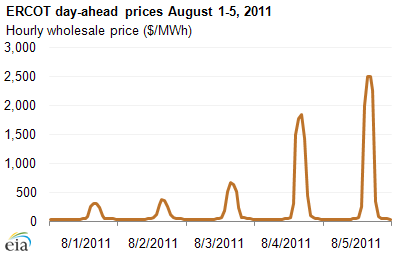
graph of ERCOT day-ahead prices August 1-5, 2011, as described in the article text
Source: U.S. Energy Information Administration based on ERCOT data.
Download CSV Data

Almost all wholesale electricity sold in ERCOT is sold in the day-ahead market. So almost all wholesale power sold between 3:00 and 4:00 p.m. on Friday was sold at a $2,500/MWh price. The exposure of retail customers to this price depends on whatever hedging arrangements retail suppliers may have in place.

Statistics
Analysis
Tools
Education
News

Petroleum & Other Liquids

Crude oil, gasoline, heating oil, diesel, propane, and other liquids including biofuels and natural gas liquids.

Natural Gas

Exploration and reserves, storage, imports and exports, production, prices, sales.

Electricity

Sales, revenue and prices, power plants, fuel use, stocks, generation, trade, demand & emissions.

Coal

Reserves, production, prices, employment and productivity, distribution, stocks, imports and exports.

Nuclear & Uranium

Uranium fuel, nuclear reactors, generation, spent fuel.

Renewable & Alternative Fuels

Includes hydropower, solar, wind, geothermal, biomass and ethanol.

EIA Survey Forms

Forms EIA uses to collect energy data including descriptions, links to survey instructions, and additional information.

Total Energy

Comprehensive data summaries, comparisons, analysis, and projections integrated across all energy sources.

U.S. States

State energy information, including overviews, rankings, data, and analyses.

International

International energy information, including overviews, rankings, data, and analyses.

Environment

Greenhouse gas data, voluntary reporting, electric power plant emissions.

Data Tools, Apps, & Maps

Tools to customize searches, view specific data sets, study detailed documentation, and access time-series data.

Open Data

EIA's free and open data available as API, Excel add-in, bulk files, and widgets

EIA Beta

Come test out some of the products still in development and let us know what you think!

Open Source Code

EIA's open source code, available on GitHub.

RSS Feeds

Subscribe to feeds for updates on EIA products including Today in Energy and What's New.