Menu
Crude oil, gasoline, heating oil, diesel, propane, and other liquids including biofuels and natural gas liquids.
Exploration and reserves, storage, imports and exports, production, prices, sales.
Sales, revenue and prices, power plants, fuel use, stocks, generation, trade, demand & emissions.
Energy use in homes, commercial buildings, manufacturing, and transportation.
Reserves, production, prices, employment and productivity, distribution, stocks, imports and exports.
Includes hydropower, solar, wind, geothermal, biomass and ethanol.
Uranium fuel, nuclear reactors, generation, spent fuel.
Comprehensive data summaries, comparisons, analysis, and projections integrated across all energy sources.
Monthly and yearly energy forecasts, analysis of energy topics, financial analysis, congressional reports.
Financial market analysis and financial data for major energy companies.
Greenhouse gas data, voluntary reporting, electric power plant emissions.
Maps, tools, and resources related to energy disruptions and infrastructure.
State energy information, including overviews, rankings, data, and analyses.
Maps by energy source and topic, includes forecast maps.
International energy information, including overviews, rankings, data, and analyses.
Regional energy information including dashboards, maps, data, and analyses.
Tools to customize searches, view specific data sets, study detailed documentation, and access time-series data.
EIA's free and open data available as API, Excel add-in, bulk files, and widgets
Come test out some of the products still in development and let us know what you think!
EIA's open source code, available on GitHub.
Forms EIA uses to collect energy data including descriptions, links to survey instructions, and additional information.
Sign up for email subscriptions to receive messages about specific EIA products
Subscribe to feeds for updates on EIA products including Today in Energy and What's New.
Short, timely articles with graphics on energy, facts, issues, and trends.
Lesson plans, science fair experiments, field trips, teacher guide, and career corner.
EIA is continuing normal publication schedules and data collection until further notice.
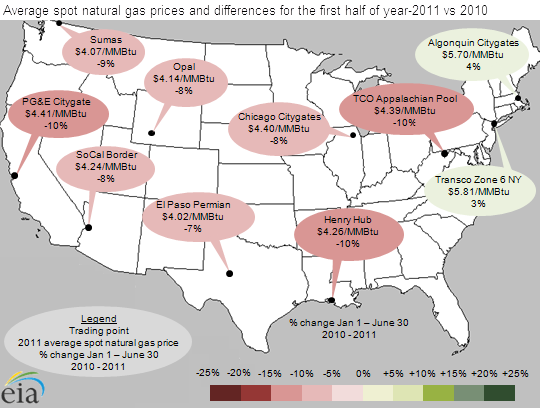
Average spot natural gas prices, which reflect the wholesale price of natural gas at major trading points, generally declined in most U.S. regional markets about 7% to 10% during the first half (January 1 to June 30) of 2011 compared to the same period in 2010. The chief exception was at certain trading points in the Northeast region where natural gas prices rose up to 4%, mainly due to pipeline constraints. Natural gas prices fell at the Henry Hub—a key benchmark and liquid trading location—about 45 cents per million British thermal units (MMBtu).
Natural gas production has been growing faster than consumption, putting downward pressure on spot gas prices—which averaged under $4.50 per MMBtu in most markets. EIA figures indicate that dry natural gas production in 2011 was up 6.0%, or over 500 Bcf from January through May, compared to the same period last year. More recent estimates of year-to-date dry gas production figures from Bentek Energy show similar trends. Domestic natural gas production gains more than offset declines in LNG deliveries and net gas imports via pipelines. EIA figures show that natural gas consumption was up only 2.0%, or 212 Bcf, through the first five months of the year.
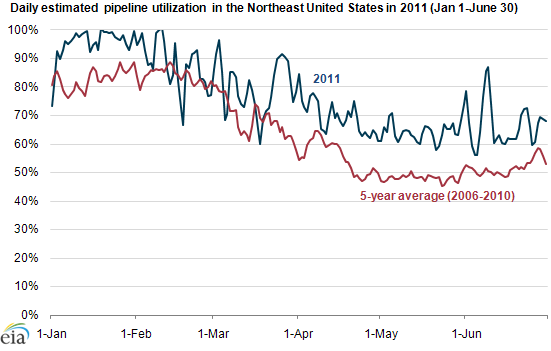
Average spot natural gas prices for delivery in the Northeast United States are up slightly due to increased pipeline utilization. Through the first six months of 2011, the estimated average utilization of pipelines delivering natural gas into the Northeast United States was 77%, compared to the 5-year average of 65% (see chart below). Increased congestion on pipelines serving the Northeast United States contributed to higher transportation costs and hence higher delivered spot natural gas prices.
Tags: consumption/demand, LNG (liquefied natural gas), natural gas, production/supply, spot prices