
Demand response saves electricity during times of high demand
Demand response in the electricity market involves the targeted reduction of electricity use during times of high demand. In response, customers receive incentives for these reductions. A recent Supreme Court ruling is expected to result in faster growth in demand response in the wholesale electricity markets that cover about 60% of U.S. power supply.
Demand response is one element of demand-side management, which includes increased adoption of energy efficient equipment at residential, commercial, and industrial customer locations. Some programs allow electric power system operators to directly reduce customers' load by temporarily turning off cooling equipment or industrial processes, for instance. In other programs, customers retain control and can choose to participate in announced demand-response events. Equipment such as advanced metering systems and appliances that can be remotely cycled by grid operators (for example, air conditioners and water heaters) is a component of demand-response programs.
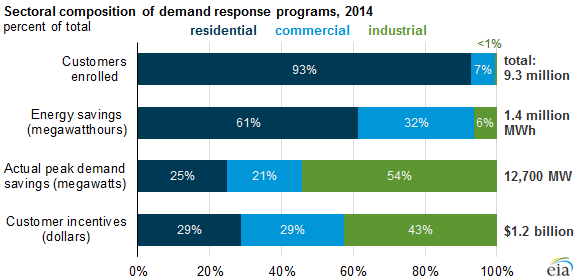
Based on data collected in EIA's annual survey of electric power sales, revenue, and energy efficiency (Form EIA-861), about 9.3 million customers in the United States participated in demand response programs in 2014. Most of these customers (93%) were in the residential sector, with the average residential customer saving about 100 kilowatthours annually and in turn receiving about $40.
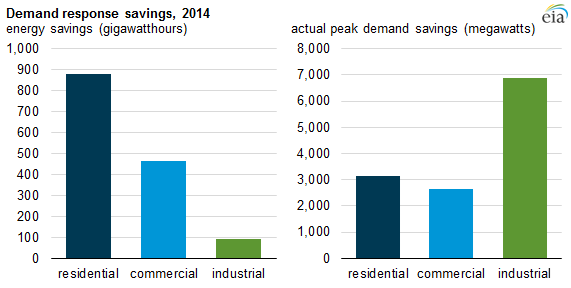
Commercial and industrial customers make up a small share of the number of demand-response customers (7% and less than 1%, respectively), but they provide larger shares of the energy savings and receive much larger incentives. Industrial customers delivered more than half of all actual peak demand savings from demand response in 2014. The average annual commercial customer incentive was almost $600, while the average industrial incentive was more than $9,000. California is the most active state in demand-response markets: the state contains 12% of the nation's population but has 20% of the total demand-response customers and contributes 20% of the total peak demand savings.
Because demand-response actions often occur during times of peak electricity demand, demand response provides value to the electric system in several ways. Lower demand means that less efficient, and often more expensive, forms of electricity generation do not need to come online during times of high demand. Reducing the amount of demand often results in lower wholesale electricity prices. Less demand means less stress on transmission and distribution systems, making them less likely to fail.
On January 15, the Supreme Court overturned a lower court's ruling concerning the way demand response could participate in wholesale electricity markets. In wholesale markets, grid administrators accept bids from electricity generators to continuously match supply with demand. Bids are ordered from lowest to highest, and they are accepted until the supply sufficiently meets demand. All bidders are then compensated at the rate of the highest-accepted bid, known as the locational marginal price (LMP).
The court's decision focused on Order 745 from the Federal Energy Regulatory Commission (FERC), which stated that demand-response providers could be compensated based on the LMP, as if they were generators. A lower court had vacated Order 745, but the Supreme Court overturned the lower court's ruling, providing assurance that demand response will continue to play a role in wholesale electricity markets. The ruling may increase the market for demand response in the near term, especially as more advanced electric meters and appliances and equipment that can be cycled by grid operators continue to be adopted.
Principal contributor: Owen Comstock