U.S. Energy Information Administration logo
Skip to sub-navigation
August 2, 2011

Wind generating capacity is distributed unevenly across the United States
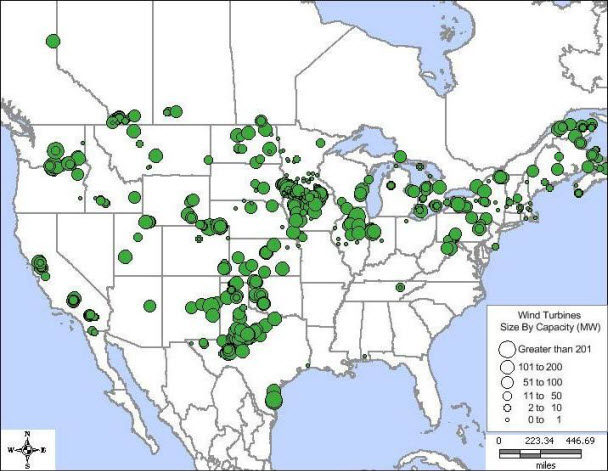
graph of Wind generating capacity is distributed unevenly across the United States, as described in the article text
Source: U.S. Energy Information Administration based on the Ventyx Energy Velocity Suite.
Note: Individual utility-scale wind turbines range from less than 1 MW to a few MW in capacity. Most circles on the map above represent multiple turbines connected to the grid at a single location.

The highest concentration of wind turbines in the United States is in the Great Plains states, where the best conditions for onshore wind power generation exist. The siting of wind turbines is dependent on the surrounding climate, as turbines are best utilized in windy areas (see wind resource map below).

However, wind capacity also exists in other areas of the United States, especially in places where local requirements such as Renewable Portfolio Standards (RPS) (see Database of State Incentives for Renewables and & Efficiency) support wind capacity expansion.

Extremely low wind-generating capacity in the Southeastern United States reflects both low average wind speeds and the lack of wind-focused, State-level RPS programs. Further, this region has a large existing inventory of relatively new natural gas combined-cycle plants that are not fully utilized.

In 2010, the United States had 38 gigawatts of installed wind capacity, which generated 2.3% of the nation's electricity, according to preliminary EIA data.
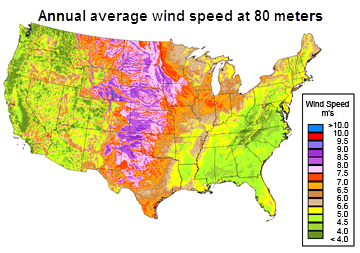
map of annual average wind speeds at 80 meters, as described in the article text
Source: AWS Truewind, LLC, for the U.S. Department of Energy
Note: A larger version of this map is available. The map displays the predicted mean annual wind speeds at 80 meters above the ground surface.

Statistics
Analysis
Tools
Education
News

Petroleum & Other Liquids

Crude oil, gasoline, heating oil, diesel, propane, and other liquids including biofuels and natural gas liquids.

Natural Gas

Exploration and reserves, storage, imports and exports, production, prices, sales.

Electricity

Sales, revenue and prices, power plants, fuel use, stocks, generation, trade, demand & emissions.

Coal

Reserves, production, prices, employment and productivity, distribution, stocks, imports and exports.

Nuclear & Uranium

Uranium fuel, nuclear reactors, generation, spent fuel.

Renewable & Alternative Fuels

Includes hydropower, solar, wind, geothermal, biomass and ethanol.

EIA Survey Forms

Forms EIA uses to collect energy data including descriptions, links to survey instructions, and additional information.

Total Energy

Comprehensive data summaries, comparisons, analysis, and projections integrated across all energy sources.

U.S. States

State energy information, including overviews, rankings, data, and analyses.

International

International energy information, including overviews, rankings, data, and analyses.

Environment

Greenhouse gas data, voluntary reporting, electric power plant emissions.

Data Tools, Apps, & Maps

Tools to customize searches, view specific data sets, study detailed documentation, and access time-series data.

Open Data

EIA's free and open data available as API, Excel add-in, bulk files, and widgets

EIA Beta

Come test out some of the products still in development and let us know what you think!

Open Source Code

EIA's open source code, available on GitHub.

RSS Feeds

Subscribe to feeds for updates on EIA products including Today in Energy and What's New.