Hydrogen for refineries is increasingly provided by industrial suppliers
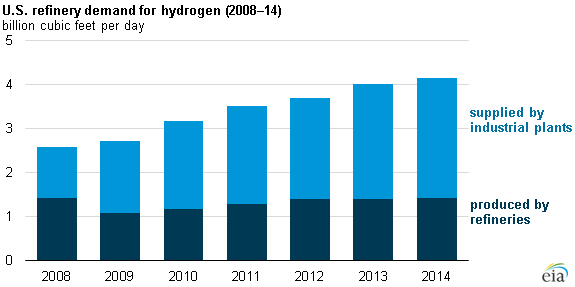
Refineries use hydrogen to lower the sulfur content of diesel fuel. Refinery demand for hydrogen has increased as demand for diesel fuel has risen both domestically and internationally, and as sulfur-content regulations have become more stringent. EIA data show that much of the growth in hydrogen use at refineries is being met through hydrogen purchased from merchant suppliers rather than from increased hydrogen production on-site at the refinery. The increased use of purchased hydrogen has implications for the refining industry's use of natural gas as a feedstock.
There are two forms of hydrogen production: on-purpose hydrogen production using steam methane reformers (SMR), and hydrogen production as a by-product of other chemical processes. Natural gas is used almost exclusively as feedstock for on-purpose hydrogen production in SMR units in the United States. Refineries, industrial gas producers, and other chemical manufacturers all use the same SMR technology, which is 90% efficient in producing hydrogen.
By-product hydrogen can be obtained from a chemical plant or other facility for which hydrogen is not the main product. In the chemical industry, for example, the chlor-alkali industry produces hydrogen as a by-product of chlorine production, and petrochemical plants release hydrogen as a by-product of their olefin production. Refineries also produce some by-product hydrogen from the catalytic reforming of naphtha into higher value high-octane products, but that supply meets only a fraction of their hydrogen needs.
EIA surveys petroleum refineries and provides estimates of net hydrogen demand at the refinery, natural gas feedstock used to produce hydrogen, and hydrogen production capacity on an annual basis. Because the total amount of hydrogen demand is known, and on-site production in the refinery SMRs can be derived from the surveyed natural gas feedstock requirements based on the known characteristics of the SMR process, the amount of merchant hydrogen supplied can be calculated by subtracting this on-site production of hydrogen from total refinery hydrogen demand. Comparing 2008 and 2014, on-site refinery hydrogen production changed very little (less than 1%), while hydrogen supplied by merchant producers increased by 135%.
Industrial gas producers are well-suited to deliver a consistent supply of hydrogen to petroleum refineries using a combination of SMR production and by-product hydrogen from nearby chemical plants. In addition, industrial gas producers are able to take advantage of an expanding network of hydrogen gas pipelines, especially in the U.S. Gulf Coast, which enhances their reliability to distribute hydrogen to their customers.
Because the growth in supply of hydrogen used at refineries has come from these industrial gas producers rather than on-site production, the amount of natural gas feedstock consumed by refineries to make hydrogen has changed very little (decreased by 1% from 2008 to 2014) even though refineries' total hydrogen use increased 60% in the same period. If the increase in refiners' hydrogen demand from 2008 to 2014 had been met with increased on-site production using refinery SMRs, the use of natural gas feedstock by refiners would have doubled over the 2008–14 period.
Principal contributors: Susan Hicks, Peter Gross
Tags: diesel, natural gas, refining