Menu
Crude oil, gasoline, heating oil, diesel, propane, and other liquids including biofuels and natural gas liquids.
Exploration and reserves, storage, imports and exports, production, prices, sales.
Sales, revenue and prices, power plants, fuel use, stocks, generation, trade, demand & emissions.
Energy use in homes, commercial buildings, manufacturing, and transportation.
Reserves, production, prices, employment and productivity, distribution, stocks, imports and exports.
Includes hydropower, solar, wind, geothermal, biomass and ethanol.
Uranium fuel, nuclear reactors, generation, spent fuel.
Comprehensive data summaries, comparisons, analysis, and projections integrated across all energy sources.
Monthly and yearly energy forecasts, analysis of energy topics, financial analysis, congressional reports.
Financial market analysis and financial data for major energy companies.
Greenhouse gas data, voluntary reporting, electric power plant emissions.
Maps, tools, and resources related to energy disruptions and infrastructure.
State energy information, including overviews, rankings, data, and analyses.
Maps by energy source and topic, includes forecast maps.
International energy information, including overviews, rankings, data, and analyses.
Regional energy information including dashboards, maps, data, and analyses.
Tools to customize searches, view specific data sets, study detailed documentation, and access time-series data.
EIA's free and open data available as API, Excel add-in, bulk files, and widgets
Come test out some of the products still in development and let us know what you think!
EIA's open source code, available on GitHub.
Forms EIA uses to collect energy data including descriptions, links to survey instructions, and additional information.
Sign up for email subscriptions to receive messages about specific EIA products
Subscribe to feeds for updates on EIA products including Today in Energy and What's New.
Short, timely articles with graphics on energy, facts, issues, and trends.
Lesson plans, science fair experiments, field trips, teacher guide, and career corner.
Republished December 14, 9:00 a.m. to correct an error in the graph.
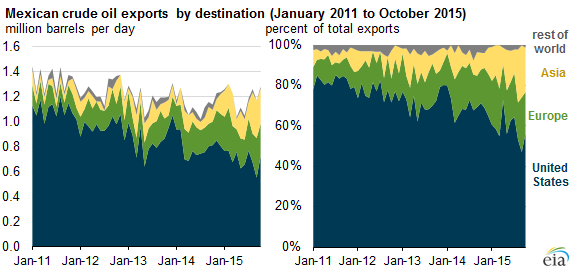
In September 2015, monthly U.S. crude oil imports from Mexico totaled 0.6 million barrels per day (b/d), the lowest level since 1990, and a decrease of about 50% since January 2011. Meanwhile, Mexico's exports of heavy crude oil to Asia and light crude oil to Europe rose, according to data from Mexico's national oil company Petróleos Mexicanos (Pemex).
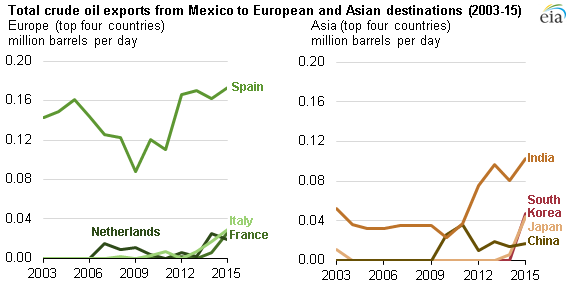
Most of Mexico's exports are of heavy crude oil, which Pemex defines as crude oil with an API gravity equal to or below 27 degrees. Heavy crude oil volumes sent to U.S. Gulf Coast (Petroleum Administration for Defense District 3) refineries have fallen as new infrastructure has allowed greater volumes of Western Canadian Select heavy crude oil to reach PADD 3 refineries. In addition, production of Maya crude oil from the offshore Cantarell field, traditionally Mexico's largest oil field, has decreased significantly. As Mexican heavy crude oil exports to the United States have decreased, increasing volumes have been sold to Asian markets, especially India, and to a lesser extent South Korea and Japan. Greater volumes of heavy crude oil have been processed in Mexico's domestic refineries, partially offsetting a decline in processed volumes of lighter domestic crude types.
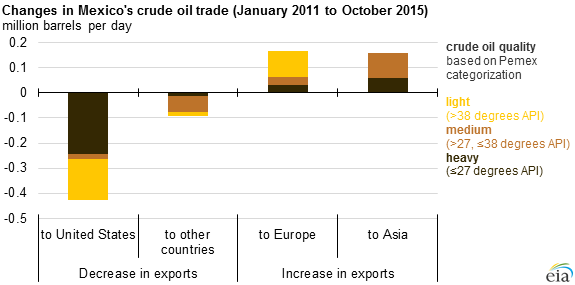
A drop in Mexican exports of light crude oil (API gravity above 38 degrees) to the United States has been largely offset by increased light crude exports to Europe, especially Spain. Smaller volumes of Mexico's light crude oil have been exported to European countries such as Italy, France, and the Netherlands.
Principal contributor: Michael Ford
Tags: crude oil, Europe, exports/imports, international, liquid fuels, Mexico