Energy use by federal agencies continues to decline
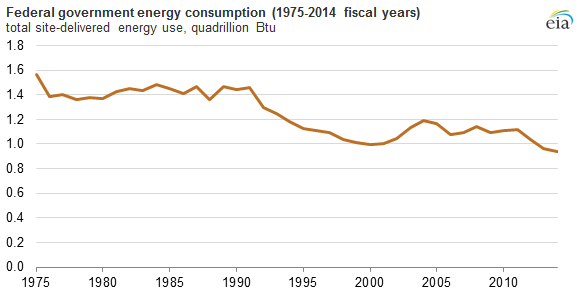
Note: Annual values reflect fiscal years.
According to the Federal Energy Management Program (FEMP), energy consumption by the U.S. federal government fell to 0.94 quadrillion British thermal units (Btu) in fiscal year (FY) 2014, the lowest level since data collection began in FY 1975. Declines in jet fuel consumption by the U.S. Department of Defense accounted for most of the decrease in federal energy use. Several data series on federal government energy use now appear in EIA's Monthly Energy Review.
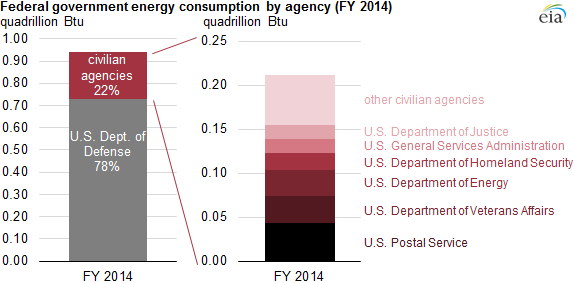
In FY 2014, energy consumption by the U.S. Department of Defense made up 78% of total federal energy use. Civilian agencies such as the U.S. Postal Service, the U.S. Department of Veterans Affairs, and the U.S. Department of Energy accounted for the next highest percentages of total federal energy use at 5%, 3%, and 3%, respectively.
The Energy Independence Act of 2007 included energy reduction goals for federal agencies, including targets for reducing energy intensity and fossil fuel consumption in buildings, reducing petroleum consumption in transportation fleets, and increasing the use of alternative fuels. In March 2015, an Executive Order established additional federal government goals to reduce energy consumption and energy-related emissions. Among the goals are:
Renewable and alternative energy sources: A target of 25% of federal building energy use to be sourced from renewable and alternative sources by FY 2025, with an intermediate goal of 10% by FY 2016. In FY 2014, 6.1% of the energy used in federal buildings came from renewables.
Greenhouse gas emissions from vehicle fleets: A 30% decrease in per-mile greenhouse gas emissions from agency fleet vehicles by FY 2025 compared with an FY 2014 baseline. Over the previous five fiscal years, greenhouse gas emissions from the federal fleet have fallen by a total of 3%.
Energy intensity: An annual 2.5% reduction through FY 2025 in federal building energy intensity, measured in Btu per square foot compared to the FY 2015 baseline. From FY 2003 to FY 2014, the federal government reduced building energy intensity an average of 1.9% per year.
Water intensity: A 36% reduction in water intensity in federal buildings, measured in gallons per square foot, by FY 2025 compared with an FY 2007 baseline. Federal agencies have already reduced water intensity by 21% compared with the baseline.
Alternative-fuel vehicles: A target for new agency-owned vehicle acquisitions of zero emission vehicles or plug-in hybrids to make up 20% of all new, agency-owned vehicle acquisitions by FY 2020, with the share rising to 50% by FY 2025. Since FY 2010, the number of traditional gasoline-powered vehicles owned by government agencies has declined 10%. Over the same period, the number of vehicles capable of using E85 grew 30%, electric vehicles increased 64%, and diesel vehicles declined 2%. The agency with the largest fleet, the U.S. Postal Service, accounts for 47% of all agency-owned vehicles, and in the past 10 years more than half of its vehicle acquisitions have been vehicles that can run on gasoline blends of up to 85% ethanol.
Principal contributors: Rebecca George, Allen McFarland