EIA expands monthly reporting of crude oil production with new data on API gravity
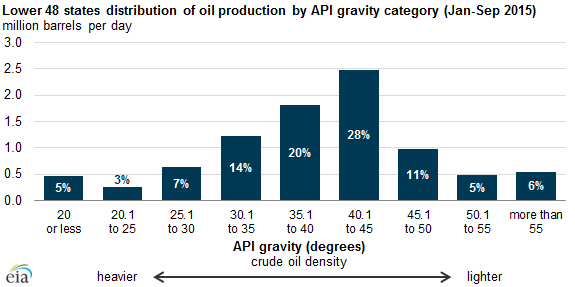
New data released yesterday by the U.S. Energy Information Administration show that for the first nine months of 2015, most (50.8%) of the crude oil produced in the Lower 48 states were light oils with an API gravity above 40 degrees. The largest share of production was in the 40.1 to 45 degree API gravity range.
The new data come from the recently expanded EIA-914 survey, which collects data on production from oil and natural gas well operators. EIA surveys operators for their production in 15 individual states and the federal offshore Gulf of Mexico. Production from the remaining producing states is collected in a category for other states. The results are published in the Monthly Crude Oil and Natural Gas Production Report.
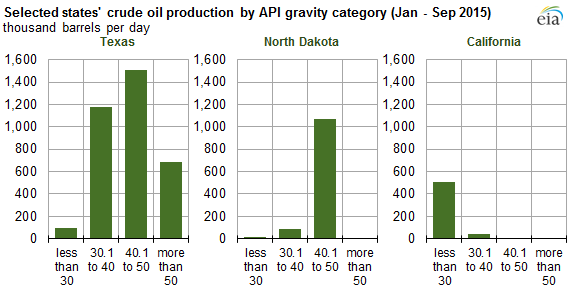
Aggregated production volumes for the Lower 48 states are reported for 10 API gravity categories that range from less than or equal to 20 degrees to above 55 degrees, along with a category for volumes whose API gravity is unknown. For individual states, the data are condensed into four categories: less than or equal to 30 degrees, 30.1-40 degrees, 40.1-50 degrees, and above 50 degrees.
Crude oil production streams vary throughout the Lower 48 states. For example, crude oils produced in Texas, North Dakota, and California have significantly different characteristics. Texas has a relatively broad distribution of crude oil quality, with most production ranging from medium gravity oils to light oils. Oil produced in North Dakota tends to be light—more than 90% of production has an API gravity of 40.1 to 50 degrees. Most of California's oil is heavy, with more than 90% having an API gravity of less than 30 degrees.
Production increases over the past several years in the Bakken, Permian Basin, and Eagle Ford formations account for almost all recent growth in U.S. crude oil output. These low-permeability (tight) formations are producing mostly light crude oils, resulting in the majority of U.S. production in the first nine months of 2015 having an API gravity above 40 degrees.
EIA's new data on API gravity will inform a variety of topics related to U.S. crude oil production, such as refinery inputs and utilization, crude oil trade, and regional crude oil pricing.
Principal contributor: Gary Long, Emily Geary