U.S. Energy Information Administration logo
Skip to sub-navigation
November 30, 2015

U.S. oil and natural gas reserves both increase in 2014
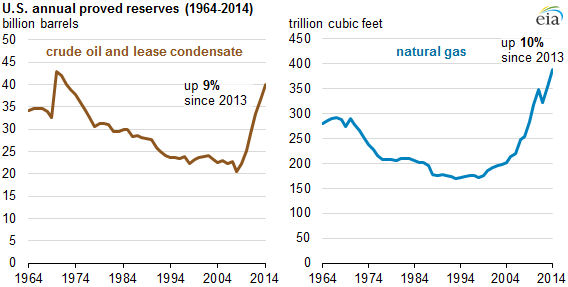
graph of U.S. crude oil and lease condensate proved reserves, as explained in the article text
Source: U.S. Energy Information Administration, U.S. Crude Oil and Natural Gas Proved Reserves

U.S. crude oil and lease condensate proved reserves increased by 9% to 39.9 billion barrels, and natural gas proved reserves increased by 10% to 389 trillion cubic feet in 2014, according to EIA's U.S. Crude Oil and Natural Gas Proved Reserves report. U.S. crude oil and lease condensate proved reserves reached the highest level since 1972, and natural gas proved reserves surpassed last year's record level.

Proved reserves are volumes of oil and natural gas that geologic and engineering data demonstrate with reasonable certainty to be recoverable under existing economic and operating conditions. Because they depend on economic factors, proved reserves shrink or grow as commodity prices and extraction costs change. EIA's estimates of proved reserves are based on an annual survey of domestic oil and natural gas well operators.

Texas had the largest increase in proved reserves of crude oil and lease condensate, representing 60% of the nation's total net increase in 2014. This increase was driven by development of tight oil plays (e.g., Wolfcamp, Bone Spring) in the Permian Basin and the Eagle Ford Shale play. North Dakota had the second-largest increase, 362 million barrels, which came mostly from the Bakken tight oil play in the Williston Basin.
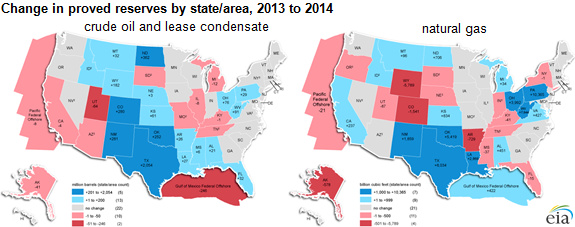
map of changes in proved reserves by state/area, as explained in the article text
Source: U.S. Energy Information Administration, U.S. Crude Oil and Natural Gas Proved Reserves
Note: Click to enlarge.

Proved natural gas reserves were added onshore in the Lower 48 states in several of the nation's shale formations, particularly the Marcellus Shale play in Pennsylvania and West Virginia, the Eagle Ford Shale play in Texas, the Woodford Shale play in Oklahoma, and the Utica Shale play in Ohio. Natural gas in shale plays now represents slightly more than half the U.S. total natural gas proved reserves.

Sustained lower prices for crude oil and natural gas in 2015 are anticipated to reduce oil and natural gas proved reserves in EIA's next annual report (for year-end 2015). Lower prices have curtailed oil and natural gas drilling and have made recovery economics more challenging. Although resource estimates are not necessarily reduced by lower prices, the calculation of proved reserves is sensitive to price.
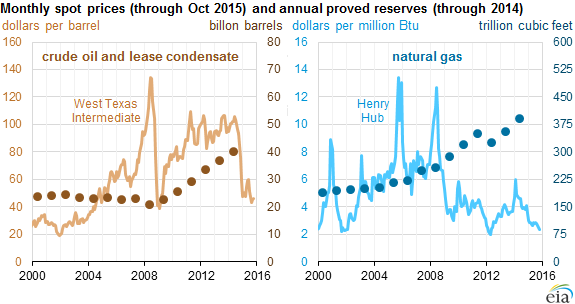
graph of monthly oil and natural gas prices with annual reserve levels, as explained in the article text
Source: U.S. Energy Information Administration, U.S. Crude Oil and Natural Gas Proved Reserves

Principal contributor: Steven Grape

Statistics
Analysis
Tools
Education
News

Petroleum & Other Liquids

Crude oil, gasoline, heating oil, diesel, propane, and other liquids including biofuels and natural gas liquids.

Natural Gas

Exploration and reserves, storage, imports and exports, production, prices, sales.

Electricity

Sales, revenue and prices, power plants, fuel use, stocks, generation, trade, demand & emissions.

Coal

Reserves, production, prices, employment and productivity, distribution, stocks, imports and exports.

Nuclear & Uranium

Uranium fuel, nuclear reactors, generation, spent fuel.

Renewable & Alternative Fuels

Includes hydropower, solar, wind, geothermal, biomass and ethanol.

EIA Survey Forms

Forms EIA uses to collect energy data including descriptions, links to survey instructions, and additional information.

Total Energy

Comprehensive data summaries, comparisons, analysis, and projections integrated across all energy sources.

U.S. States

State energy information, including overviews, rankings, data, and analyses.

International

International energy information, including overviews, rankings, data, and analyses.

Environment

Greenhouse gas data, voluntary reporting, electric power plant emissions.

Data Tools, Apps, & Maps

Tools to customize searches, view specific data sets, study detailed documentation, and access time-series data.

Open Data

EIA's free and open data available as API, Excel add-in, bulk files, and widgets

EIA Beta

Come test out some of the products still in development and let us know what you think!

Open Source Code

EIA's open source code, available on GitHub.

RSS Feeds

Subscribe to feeds for updates on EIA products including Today in Energy and What's New.