
U.S. energy-related CO2 emissions up 1% in 2014 as buildings, transport energy use rises
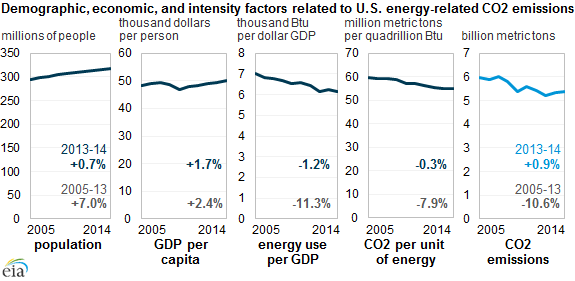
Note: Growth rates for 2005-13 reflect total change between those two years.
U.S. energy-related carbon dioxide (CO2) emissions were 5,406 million metric tons (MMmt) in 2014, 1% (51 MMmt) above their 2013 level. Energy-related emissions also increased in 2013, but because of declines in earlier years, the 2014 emissions were still roughly 10% below their 2005 level.
One approach to assessing emissions trends considers changes in demographic and economic drivers, together with changes in the relationship between economic activity and energy use and the carbon content of energy. Increases in economic activity, reflecting changes in population and per capita output, tend to increase emissions. Reductions in energy consumed per unit of economic activity or emissions generated per unit of energy tend to reduce emissions. In 2014, U.S. gross domestic product (GDP) grew 2.4%, while energy use per GDP and carbon per unit energy declined 1.2% and 0.3%, respectively.
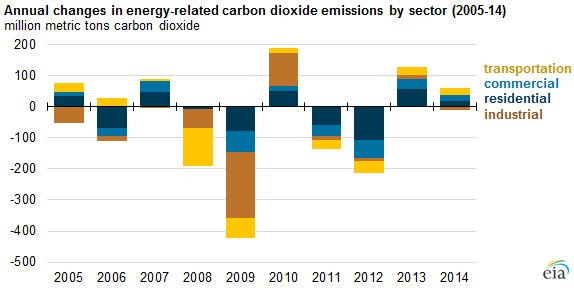
Changes in energy-related emissions can also be analyzed by consuming sector. Emissions attributed to energy use in the residential, commercial, industrial, and transportation sectors tracked in EIA's data are measured by each sector's consumption of various fuels. In this accounting, emissions associated with the generation of electricity are apportioned based on the electricity consumption in each sector.
In 2014, energy-related CO2 emissions in the transportation sector were 24 MMmt higher than the 2013 level. Transportation fuel prices declined between 2013 and 2014. Lower prices, along with continued economic recovery, led to higher gasoline consumption, along with higher consumption of other fuels. The growth in energy consumption more than offset improvements in the fuel economy of the vehicle fleet.
Commercial sector CO2 emissions rose by 19 MMmt, while residential sector emissions increased by 18 MMmt. Although residential sector energy use is mainly influenced by weather on a year-to-year basis, commercial sector energy use reflects both weather and economic activity. Most of the increase in energy use in the residential sector came in the first quarter of 2014, when heating degree days (a temperature-based measure of expected heating demand) were 10% higher than in 2013.
The industrial sector experienced an overall decline in energy-related CO2 emissions of 11 MMmt in 2014 despite a 13 MMmt increase in natural gas emissions. Because natural gas has the lowest carbon intensity of the fossil fuels, higher use of natural gas meant that more energy was being delivered with fewer overall emissions compared to coal and petroleum liquids, the fuels it likely replaced.
Principal contributor: Perry Lindstrom