
Texas expected to keep breaking records for wind generation as wind capacity grows
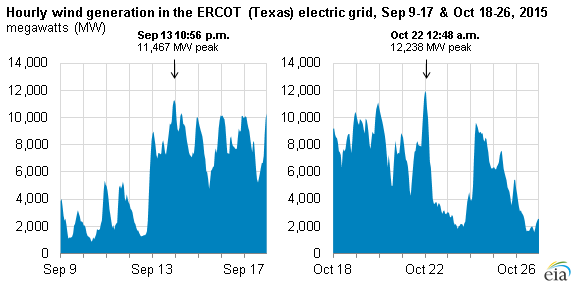
Note: Hourly averaged generation shown. Instantaneous peaks highlighted in the hour in which they occurred.
Wind generation on the Texas electric system recently hit several all-time highs. The latest all-time instantaneous peak of 12,238 megawatts (MW) reached on October 22 replaced the short-lived records of 11,467 MW on September 13 and 11,950 MW on October 21, based on data from the grid's operator, the Electric Reliability Council of Texas (ERCOT). Substantial additions of new wind generating capacity, coupled with strong wind conditions amid unseasonably warm early-autumn temperatures, drove the recent generation records.
During the recent peaks in September and October, wind generators in ERCOT were running at an overall 75%–81% utilization of total generating capacity (called the capacity factor), lower than the 83% capacity factor recorded during an earlier generation peak in February 2015 of 11,154 MW. The recent additions of wind capacity led to higher output overall in September and October, despite the lower capacity factors. Because of seasonal wind patterns (spring and autumn typically see the highest amounts of wind generation in Texas and across most of the country) and new capacity continuing to come online, the October 22 record will very likely be surpassed in the near future.
In ERCOT, as well as in the United States overall, additions of wind capacity experienced a strong recovery starting in mid-2014 and continuing through 2015. Prior to that, wind additions came to a virtual stop in 2013 and through the first half of 2014 following the expiration, delayed renewal, and modification of the federal renewable energy production tax credit.
Less than 100 MW of wind capacity was installed in ERCOT in the 17 months from January 2013 through May 2014, but more than 4,000 MW was installed in the 16 months from June 2014 through September 2015. An additional 1,000-2,000 MW is planned to be installed by the end of 2015.
Total wind capacity installations in the United States followed a similar pattern: about 1,500 MW of wind capacity was installed in 2013 through May 2014, and more than 7,700 MW was installed from June 2014 through August 2015. An additional 4,600 MW has been reported as planned to be installed by the end of 2015.
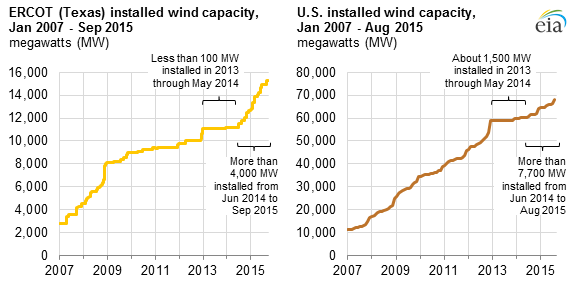
Note: U.S. data include facilities with a nameplate capacity of 1 MW and above. 2015 data for U.S. are preliminary.
Renewable energy projects often have shorter lead times than other generator capacity additions. To help track monthly generator activity, EIA has started publishing a monthly updated preliminary inventory of all major generating units in the United States (essentially all generators located at power plants with a total plant capacity of 1 MW or greater) as a supplement to the annually updated inventory in the EIA-860 Annual Electric Generator Report. The new dataset provides one consolidated source that includes the annual inventory along with the latest monthly updates on generator additions, retirements, and planned projects.
Principal contributor: April Lee