
Four regional transmission organizations set new or nearly broke demand records last week
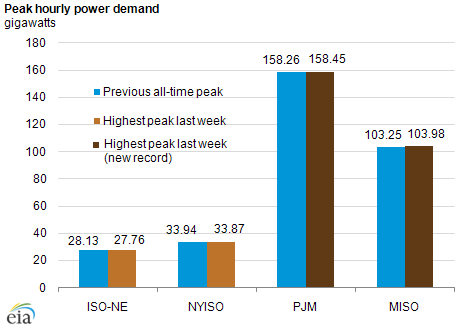
Note: Data collated from websites for the ISO New England, the New York Independent System Operator, the PJM Interconnection, and the Midwest Independent System Operator. MISO and PJM claim new all-time peak records based on estimated adjustments to their previous all-time peak demand records reflecting changes their system service areas since 2006.
CORRECTION: ISO-NE did not set a new all-time system demand record on July 22, 2011, as previously reported in Today in Energy on July 25, 2011. The system load on July 22, 2011 was the second-highest recorded by ISO-NE. See updated story below.
Four regional transmission organizations—the Midwest Independent System Operator (MISO), the PJM Interconnection (PJM), New York Independent System Operator (NYISO) and the ISO New England (ISO-NE)—set or just missed daily demand records during the latter part of last week due to a heat wave affecting over 30 states.
MISO and PJM both issued press releases stating that they set new all-time peak records after making adjustments to their previous all-time peak demand records to reflect changes made in their system service areas since 2006. The New York Independent System Operator (NYISO) missed its all-time daily demand record (33,939 megawatts) set on August 2, 2006 by only 74 megawatts. On Friday, ISO New England reported its second highest system load ever (27,762 megawatts), or just 368 megawatts shy of its August 2, 2006 record of 28,130 megawatts.
Moving West to East, the heat wave's influence on regional demands peaked in the Midwest on Wednesday, the Mid-Atlantic on Thursday, and in New York and New England on Friday.
Day-ahead, wholesale power prices for peak hours (mid to late afternoon) generally rose from $100 per megawatt hour (MWh) during the early part of the week (see chart below) to almost $350/MWh by the end of last week in parts of the east. Day-ahead power prices were higher in PJM than in New York City; the nation's highest power prices are usually recorded in New York City.
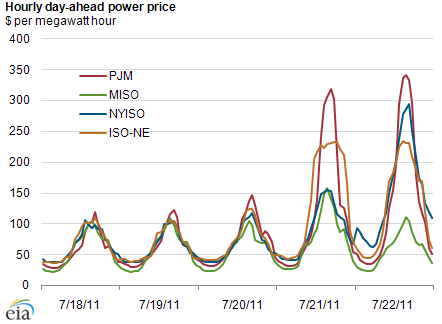
Note: Data collated from websites for the ISO New England, the New York Independent System Operator, the PJM Interconnection, and the Midwest Independent System Operator.