Natural gas prices in Asia mainly linked to crude oil, but use of spot indexes increases
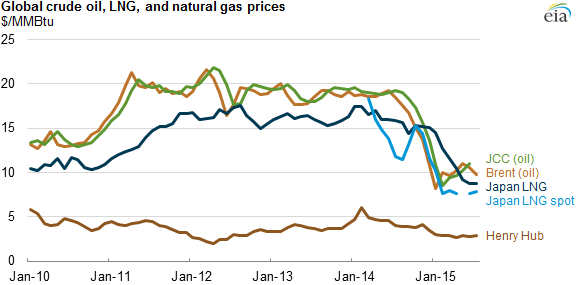
Note: Values for North Sea Brent and Japanese customs-cleared (JCC) crude oil prices converted to $/MMBtu on an energy-equivalent basis. The official reporting of Japan spot LNG price statistics began in March 2014, so no prior data exist.
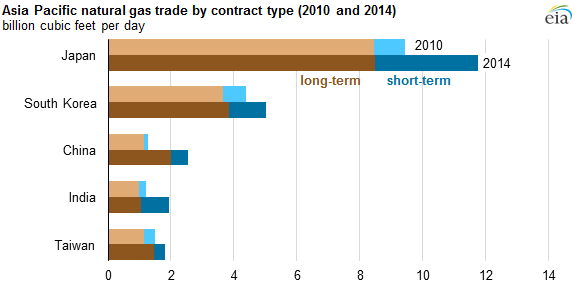
Unlike the natural gas market in the United States, natural gas prices in Asian markets typically reflect contracts that are indexed to crude oil or petroleum product prices. The declines in crude oil prices between August 2014 and January 2015 had a significant effect on Asian natural gas prices and markets. However, Asian countries are developing regional trading hubs so that natural gas prices better reflect natural gas market dynamics. In 2014, almost 30% of global liquefied natural gas (LNG) was traded on a spot and short-term basis, of which Asia Pacific trade accounted for three-quarters of the total.
In Asia most natural gas is imported as LNG, and the price is indexed to crude oil on a long-term, contractual basis. The Asia Pacific market accounts for three-quarters of global LNG trade and one-third of global natural gas trade. Over the past several years, high crude oil prices resulted in increases in LNG import prices.
There is currently no globally integrated market for natural gas, so pricing mechanisms vary by regional market. Internationally traded natural gas has been largely indexed to crude oil prices such as North Sea Brent or Japan customs-cleared crude (JCC) because of the liquidity and transparency of crude oil prices and the substitutability of natural gas and petroleum products in certain markets. For example, some Asian countries have the option to burn either natural gas or petroleum for electricity generation.
Although long-term crude oil-indexed contracts remain Asia's dominant pricing mechanism, natural gas is beginning to be traded on the spot market as one-time transactions, or under short-term contracts, which more closely reflect international natural gas supply and demand balances. Asia Pacific spot LNG trade almost tripled between 2010-14 and represented 21% of all global LNG trade and 7% of total global natural gas trade in 2014.
Several Asian countries—including Japan, China, and Singapore—are developing regional trading hubs with the goal of increasing price formation transparency:
- In September 2014, Japan launched an LNG futures contract on the Japan over-the-counter exchange (JOE), settled against Rim Intelligence Co.'s Daily Pricing Index. However, only one trade has been made on JOE since its inception. The country's lack of pipeline connectivity with other markets, low volumes of flexible LNG, and lack of LNG price transparency and liquidity have contributed to limited spot LNG trading activity on JOE.
- China launched the Shanghai Oil and Gas Exchange on July 1, 2015, which will trade both pipeline gas and LNG. China's diversified natural gas market, with expanding pipeline infrastructure and gas-on-gas competition, may offer a more liquid Asian natural gas price index, but high levels of government regulation make it less attractive as a regional benchmark.
- In June 2015, Singapore's Stock Exchange launched the Singapore SGX LNG Index Group (SLInG). The index will provide a price for LNG cargoes from Singapore to different destinations reflecting regional spot prices, but trading volumes to date have been very low.
Prices at Henry Hub, the U.S. natural gas benchmark, can also affect global pricing through LNG trade. By 2020, when all current U.S. liquefaction projects are expected to be completed, the United States will account for almost one-fifth of global liquefaction capacity and will become the third-largest LNG export capacity holder in the world, after Qatar and Australia.
Almost 80% of U.S. LNG export volumes for projects currently under construction have been contracted on pricing terms directly linked to the Henry Hub price, or under a hybrid pricing mechanism with links to Henry Hub. The flexibility in destination clauses in U.S. LNG export contracts and the introduction of hub indexes are expected to promote greater liquidity in global LNG trading and shift pricing away from oil-based indexes, contributing to the development of the Asian regional trading hubs and pricing indexes.
Principal contributors: Victoria Zaretskaya, Scott Bradley
Tags: China, crude oil, India, international, Japan, liquid fuels, natural gas, prices, South Korea