
Debt service uses a rising share of U.S. onshore oil producers’ operating cash flow
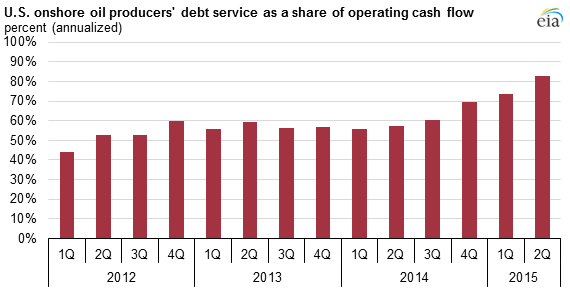
Note: Each quarter represents a rolling four-quarter sum.
Results from second-quarter 2015 financial statements of a number of U.S. companies with onshore oil operations suggest continued financial strain for some companies. Low oil prices have significantly reduced cash flow for U.S. oil producers, and to adjust to lower cash flows, companies have reduced capital expenditures and raised more cash from debt and equity.
Because of the large amount of debt accumulated from past years, a higher percentage of operating cash flow is being devoted to servicing debt. Debt service payments consist of principal repayment to creditors and typically are fixed in both amount and frequency, agreed upon before a company receives a bank loan or issues a bond.
Some companies have been able to refinance their debt—that is, paying off old debt and taking on new debt, perhaps with a different interest rate or longer maturity. This option has increasingly become more expensive, because interest rates for energy company debt issuance have risen as crude oil prices declined, and rates are now higher than for any other business sector. The spread for energy company bond yields with a credit rating below investment grade averaged 11 percentage points above the risk-free rate since August, indicating higher interest rates for energy companies.
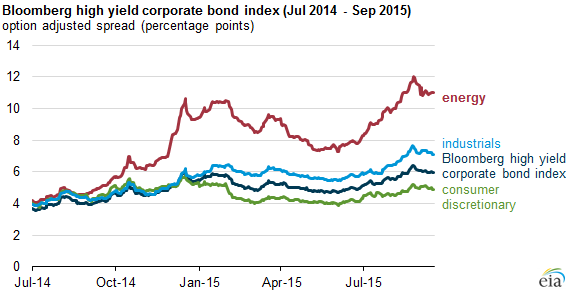
Note: A high yield bond means it was issued from a company that is rated below investment grade by a credit rating agency. An option adjusted spread measures the difference in yield on the bond index with the risk-free rate.
With fixed debt repayments and the large reduction in cash from operations for these companies, the ratio of debt repayments to operating cash flow has increased recently. For the previous four quarters from July 1, 2014 to June 30, 2015, 83% of these companies' operating cash was being devoted to debt repayments, the highest since at least 2012. As the share of debt repayment to operating cash flow increases, a company is left with less cash to use for investment opportunities, dividends, or savings for future use.
Companies that use bank credit facilities to meet their short-term cash requirements face redeterminations twice a year. With next month's round of redeterminations—which considers the valuation of companies' reserves as collateral—some companies may face challenges in raising enough cash to maintain capital expenditures and meet liabilities.
More information about the effect of lower oil prices on U.S. onshore oil companies is available in This Week in Petroleum.
Principal contributor: Jeff Barron