Unplanned refinery outage leads to higher Midwest gasoline prices
Note: PADD is Petroleum Administration for Defense District
On August 8, the BP refinery in Whiting, Indiana, the largest petroleum refinery in the Midwest, experienced an unplanned outage and was forced to reduce production. The BP Whiting refinery has a crude oil distillation unit (CDU) capacity of 413,500 barrels per calendar day (b/d), and it is an important source of gasoline and distillate fuel oil supply to the region.
Press reports indicate that the largest of three crude oil distillation units at the refinery was shut down because of leaking pipes, cutting the refinery's total operable CDU capacity by roughly 50%. EIA estimates the loss of gasoline production from that unit to be between 120,000 b/d and 140,000 b/d, based on May 2015 refinery yield data for the region and press reports of the refinery running at 40% capacity. Initial estimates are that it may take BP a month to fix the problem.
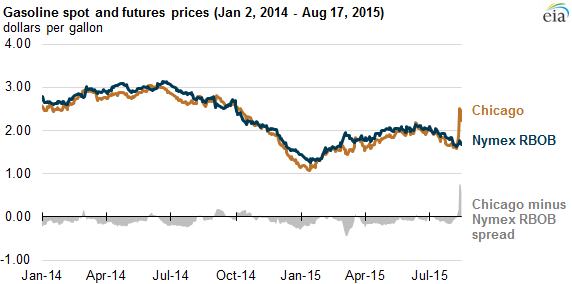
On news of the outage, the wholesale spot price for gasoline in Chicago, Illinois increased 60¢ per gallon (gal) to $2.47/gal on August 11. Regional spot gasoline prices can be compared to the front month futures contract of reformulated blendstock for oxygenate blending (RBOB, the petroleum component of gasoline) from the New York Mercantile Exchange (Nymex). Spot prices in Chicago went from a 3¢/gal discount to the New York RBOB on August 7 to a 78¢/gal premium on August 11.
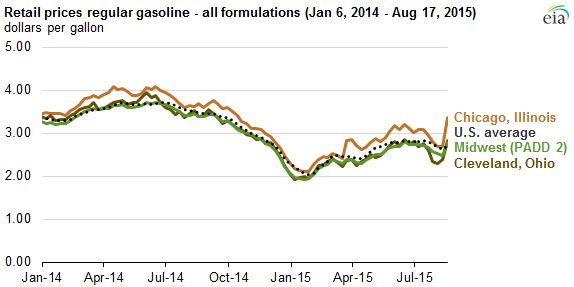
The increase in spot prices has led to higher retail gasoline prices throughout the region. On August 17, regular retail gasoline prices in the Midwest (PADD 2) increased 32¢/gal from the previous week to $2.79/gal, the largest weekly increase for Midwest gasoline prices since the aftermath of Hurricane Katrina in 2005. Average retail prices for regular gasoline in Chicago and in Cleveland, Ohio increased 68¢/gal and 43¢/gal, respectively, from the previous week to $3.37/gal and $2.83/gal, respectively.
It can take markets days or weeks to adjust to the sudden loss of production during unplanned outages, often resulting in sudden price increases. The severity and duration of the higher prices depend on how quickly the refinery problem can be resolved, how soon alternative sources of supply can arrive, and the marginal cost to bring alternative supply to the region.
Refinery outages also occurred on the West Coast earlier this year. Bounded by the Pacific Ocean and Rocky Mountains, the West Coast is relatively more isolated from other markets and thus the West Coast's alternative sources of supply are more costly and harder to obtain quickly. The upper Midwest has closer, less costly resupply alternatives.
The upper Midwest is supplied predominantly by in-region refinery production, with additional supplies arriving by an extensive pipeline and inland river system connecting the different Midwest markets to each other and to the Gulf Coast. Chicago gasoline prices moved $1.03/gal higher than those on the Gulf Coast last week, which will likely prompt supplies to move north along pipeline systems such as the Magellan and Explorer to markets in the upper Midwest.
Until those supplies arrive, the Midwest is likely to draw down inventories of motor gasoline, which were 47.5 million barrels for the week ending August 7, about 1.5 million barrels below the five-year average inventory level. Additional refinery outages, planned or unplanned, will require further adjustments to the supply chain. Trade press reports indicate a planned maintenance outage is currently underway at Marathon Petroleum's 212,000 b/d refinery in Robinson, Illinois.
Principal contributor: T. Mason Hamilton