
First offshore wind farm in the United States begins construction
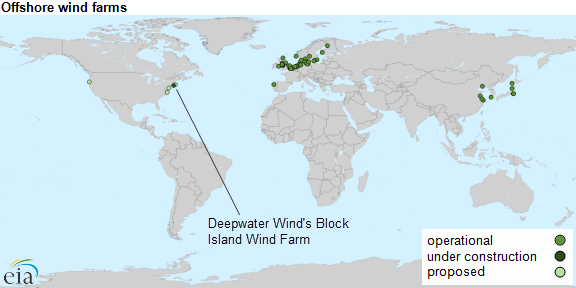
In July, American offshore wind developer, Deepwater Wind, installed the first foundation for what is expected to be the first offshore wind farm in the United States. The project will be located three miles southeast of Block Island, Rhode Island.
With five turbines totaling 30 megawatts (MW) of generation capacity, the Block Island Wind Farm is expected to come online in 2016. Deepwater Wind, the developer, is also planning two larger offshore projects along the Atlantic Coast, but their timing remains uncertain.
The National Renewable Energy Laboratory (NREL) estimates that the United States has 4,200 gigawatts (GW) of developable offshore wind potential, compared to its estimate of 11,000 GW of onshore wind potential. Wind resources are classified on a scale of zero to seven based on their power density, and more than 66% of offshore wind in the United States is in wind power class six or seven. In addition, offshore wind turbines are built to take advantage of the more consistent wind speeds present over the ocean, allowing higher utilization rates for offshore generation capacity when compared with similarly sized onshore wind turbines. However, offshore wind is significantly more expensive to build and maintain than onshore wind.
Although there are currently no operating offshore wind projects in the United States, offshore wind turbine technology has grown steadily in Europe, and, to a lesser extent, in Asia. As of 2014, Europe accounted for 90% of the estimated 8.8 GW of installed global offshore wind turbine capacity. Offshore wind power development in Europe began in 1991 when the first offshore farm was installed off the coast of Denmark, although the industry had little growth from that point until the 2000s.
In the United States, developers have proposed building nearly 4.9 GW of offshore wind capacity off the coasts of nine different states, but some challenges remain even for projects that have advanced through key regulatory and market milestones. For example, Cape Wind, a 486-MW project proposed in 2001, faced significant challenges and litigation that halted its progress. In 2014, National Grid and Eversource Energy terminated the power purchase agreements with Cape Wind because of missed project development deadlines. This past March, Cape Wind canceled its lease in New Bedford, Massachusetts, for its planned project-staging area. Other projects such as the Virginia Offshore Wind Technology Advancement Project and Fisherman's Energy Wind of New Jersey have faced development hurdles despite making significant progress in project development.
Compared with western Europe, the current leader in offshore wind energy, the United States is estimated to have more abundant and favorable onshore wind resources, which are largely located in areas with low population density. So far, the high cost of domestic offshore wind projects has made them economically unattractive, despite the availability of federal tax incentives and state policies to promote use of renewable energy. In contrast, onshore wind capacity has grown by more than a factor of 25 since 2000.
Building and maintaining offshore wind technology is expensive compared with onshore wind projects because of challenges such as transporting equipment and workers to the sites, securing turbines to the seafloor, and operating in fewer periods of fair weather. The harsher offshore environment not only makes it difficult and more costly to perform maintenance, but it also increases the frequency that these activities have to take place.
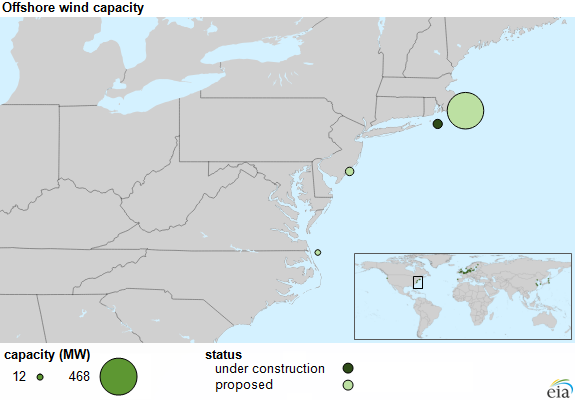
Source: U.S. Energy Information Administration, based on Lindoe Offshore Renewables Center
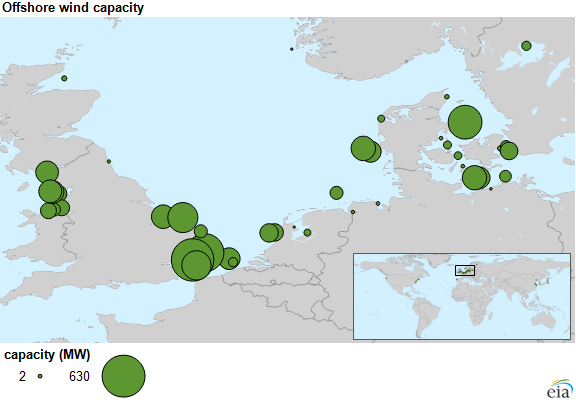
Source: U.S. Energy Information Administration, based on Lindoe Offshore Renewables Center
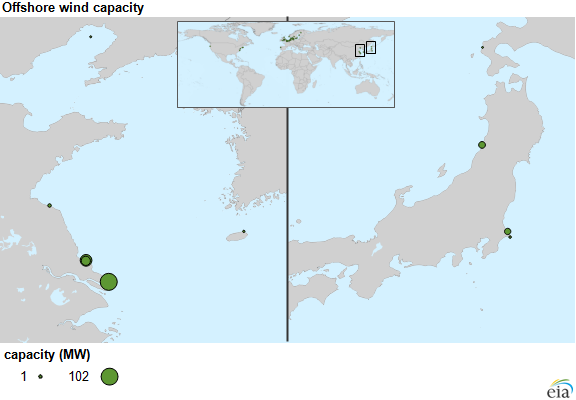
Source: U.S. Energy Information Administration, based on Lindoe Offshore Renewables Center
Principal contributors: Rachel Marsh, Cara Marcy
Tags: generating capacity, map, renewables, wind