
Refiner margins unable to fully offset low upstream earnings for integrated oil companies
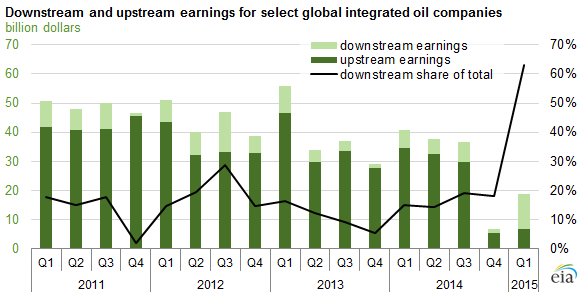
Note: Upstream refers to crude oil exploration, production, and other operations prior to refining. Downstream refers to refinery operations, product sales, and marketing.
First-quarter 2015 financial results for globally integrated oil companies—ones that focus on both the exploration and production of crude oil (upstream) and the refining of crude oil into petroleum products (downstream)—show that total earnings were $22 billion (54%) lower than in first-quarter 2014. Lower crude oil prices contributed to a decline in profits in the upstream sector of $28 billion (80%) compared to first-quarter 2014. Profits in the downstream sector, however, were the largest for any quarter since third-quarter 2012, almost $6 billion (95%) higher than in first-quarter 2014, which offset some of the decline from the upstream segment.
Crack spreads refer to the differences between wholesale petroleum product prices and crude oil prices, and they can serve as an indicator of refining profits. Crack spreads for gasoline and heating oil (based on futures prices for North Sea Brent crude oil and gasoline and heating oil in New York Harbor) averaged 28¢ per gallon (gal) and 49¢/gal, respectively, in the first quarter of 2015. These crack spreads represent year-over-year increases of 7¢/gal for gasoline and 4¢/gal for heating oil.
First-quarter earnings statements from 11 global companies show that the high crack spreads during this time contributed to higher profits in the downstream segment. Even though absolute prices for both crude oil and petroleum products declined in first-quarter 2015 compared to first-quarter 2014, North Sea Brent crude oil prices fell more than wholesale gasoline and heating oil prices, resulting in an increase in the margin from refining crude oil.
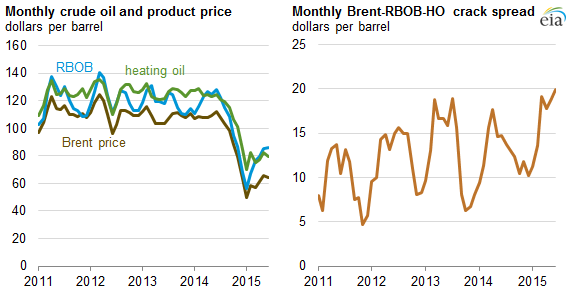
Note: Brent-RBOB-HO represents the crack spread between Brent crude oil, gasoline (RBOB), and heating oil (HO).
The combination of lower upstream earnings and higher downstream earnings led to downstream earnings accounting for 63% of combined earnings in the first quarter, compared to a 15% average downstream share from 2011 through 2014.
Principal contributors: Jeff Barron, Laura Singer