Crude by rail provides the West Coast with supply as regional crude oil production falls
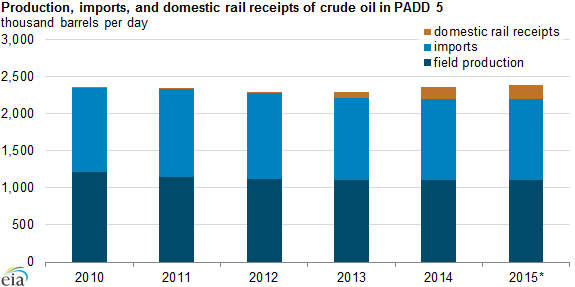
Note: 2015 reflects the average of January-March 2015.
While total U.S. crude oil production increased by nearly 3.2 million barrels per day (b/d) from 2010 to 2014, production in the West Coast region (PADD 5) decreased by 0.1 million b/d, continuing a long-term decline. With no major crude oil pipelines connecting the West Coast to other parts of the country, refineries on the West Coast adjusted to the declining in-region production by increasing imports of foreign crude oil, reaching an average of 1.1 million b/d over the past five years. Shipments of domestic crude by rail (CBR) to the West Coast have also increased, from an average of 23,000 b/d in 2012 to 157,000 b/d in 2014. In the first quarter of 2015, West Coast CBR movements averaged 191,000 b/d.
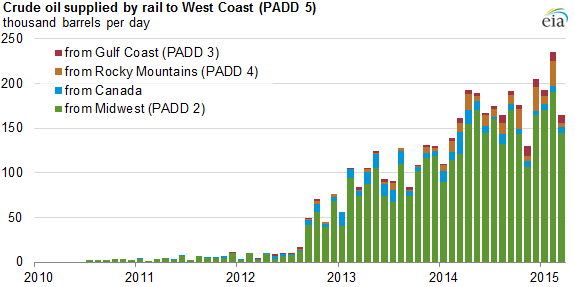
Bakken crude oil production from the Midwest (PADD 2) is the major source of rail shipments to the West Coast (PADD 5), accounting for nearly 90% of West Coast crude-by-rail receipts in 2014. Relatively small shipments from other domestic regions have also increased. Shipments from the Gulf Coast (PADD 3) tripled from 2013 to 2014, and Rocky Mountain (PADD 4) shipments quintupled. These increases in crude-by-rail movements occurred only after West Coast crude-by-rail unloading infrastructure was significantly expanded.
Crude by rail is moved to unloading facilities at refineries in Washington and terminals in California, Washington, and Oregon. Coast-wise compliant vessels and pipelines then transport the oil to refineries without crude-by-rail unloading facilities.
In California, regulatory and permitting problems have delayed construction of some crude oil unloading facilities and forced the closure of operations at others. Despite permitting delays, refineries in California receive some domestic crude oil by rail from other PADDs. California Energy Commission (CEC) data indicate that California receives crude by rail from Rocky Mountain states, specifically Utah and Wyoming.
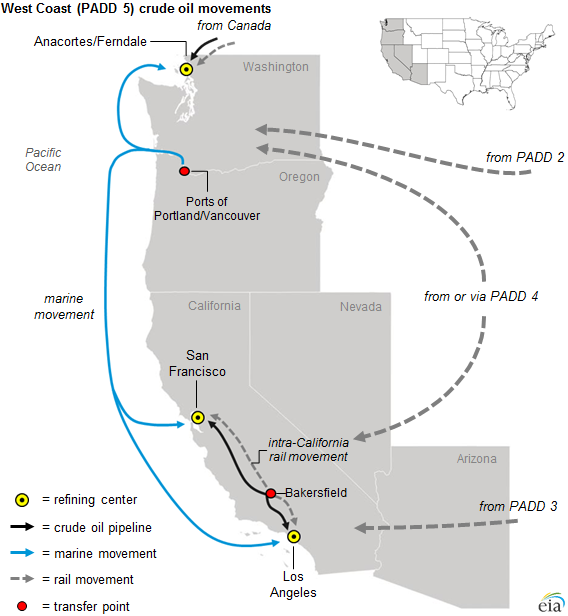
Note: Rail movements do not indicate the specific route taken and are not destination-specific.
Future increases in shipments of crude oil by rail to West Coast refineries will depend on the economic viability of crude by rail versus imported crude oil, the type of crude oil refineries are able to process, and the regulatory outcomes for new or existing crude-by-rail facilities.
Principal contributor: Arup Mallik, T. Mason Hamilton
Tags: California, crude oil, liquid fuels, map, oil/petroleum, rail, transportation