
Low crude oil prices, increased gasoline demand lead to high refiner margins
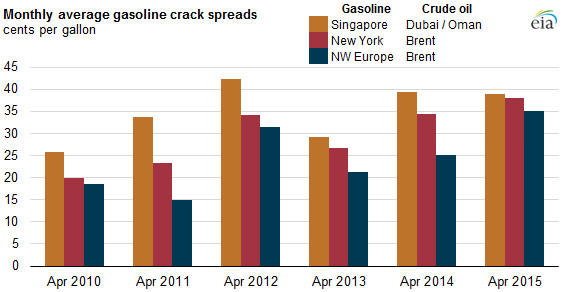
Note: Dubai/Oman crude oil spot price is the average spot price of Dubai crude oil and Oman crude oil.
Gasoline crack spreads in the United States, especially on the U.S. East Coast, have reached several-year highs in recent months. Crack spreads, which reflect the difference between wholesale product prices and crude oil prices, are a good indicator of refiner profitability.
For example, in April 2015, wholesale conventional gasoline in New York Harbor averaged $1.79 per gallon (gal), and the Brent crude oil spot price averaged $1.41/gal ($59.39 per barrel, divided by 42 gallons per barrel). The difference in prices results in a crack spread of 38 cents/gal, the highest crack spread for the month of April since 2007.
Strength in gasoline crack spreads can also be seen in regions beyond the United States. In the European gasoline market, the Northwest Europe gasoline-Brent crack spread averaged 35 cents/gal in April, the highest since at least April 2010. In Asia, the Singapore gasoline-Dubai/Oman crack spread averaged 39 cents/gal in April, similar to levels last year and 3 cents/gal below the recent high in April 2012.
Because gasoline specifications, refinery maintenance schedules, and seasonal demand patterns are not uniform across the world and can influence gasoline crack spreads at different times of the year even within a region, comparing crack spreads on a year-over-year basis allows for a better understanding of the strength of gasoline prices in a given region.
The main factors contributing to the global rise in gasoline crack spreads this year are the lowest crude oil prices in several years, robust U.S. gasoline consumption and exports, and higher-than-expected demand for liquid fuels in Europe and some countries outside the Organization for Economic Cooperation and Development (OECD).
Refiners in many regions of the world have been processing larger volumes of crude oil to take advantage of these higher gasoline crack spreads. On the U.S. East Coast, average gross inputs to refineries in April were the most for that month of the year since 2010. Refineries in Europe, where, for years, the refining sector had low profitability, now have increased refining utilization rates amid improving margins.
Although April gasoline crack spreads in Asia did not exceed recent record highs, Asian refineries have been processing more crude oil compared to the same time last year as margins from gasoline and other petroleum products in that region have remained strong since the first quarter of 2015.
Principal contributor: Rebecca George
Tags: crack spread, crude oil, gasoline, liquid fuels