U.S. Energy Information Administration logo
Skip to sub-navigation
July 7, 2011

Nuclear power plant outages above seasonal norm in spring of 2011
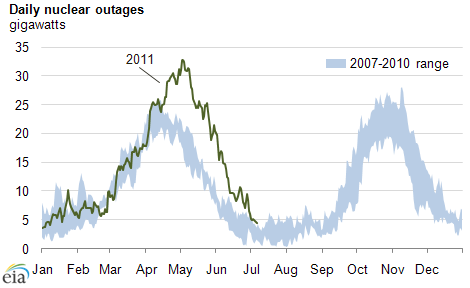
graph of Daily nuclear outages, as described in the article text
Source: U.S. Energy Information Administration based on data from the U.S. Nuclear Regulatory Commission, (Power Reactor Status Reports)
Note: Scheduled outages start when a unit's reported output drops below 100% and end when it returns to 100%.
Download CSV Data

Like most electric generators, nuclear reactor operators typically schedule maintenance in the spring and the fall to help ensure that the reactors are available to meet peak electric demand in the summer and winter. (See previous nuclear refueling outage story.) The spring of 2011 refueling season coincided with several forced outages and weather-related decreases in capacity availability.

The chart shows total daily nuclear unit outages for 2011 as well as the range of outages between 2007 and 2010 based on data available from the U.S. Nuclear Regulatory Commission (NRC). Total nuclear outages were higher in 2011 than any of the previous four years for much of April, May, June and into July.

Non-refueling outages included other planned maintenance outages and forced outages. The industry marked a ten-year high in total outages in early May 2011 with the loss of Tennessee Valley Authority's three Browns Ferry units (almost 3.5 gigawatts) due to tornado damage to transmission lines serving the plant. The Browns Ferry units remained below full capacity through May 28. Outages of Tennessee Valley Authority plants accounted for 11% of total outages during April through June.

While nuclear units are down, system demand must continue to be met through other sources, usually at a higher operating cost. The PJM region's 16 nuclear plants accounted for 22% of total nuclear plant outages between April and June. Day-ahead spot electric power prices averaged $56.58 per megawatt hour (MWh) in PJM West during April through June of 2011 compared to an average price of $52.61 per MWh during the same time period between 2007 and 2010.


Statistics
Analysis
Tools
Education
News

Petroleum & Other Liquids

Crude oil, gasoline, heating oil, diesel, propane, and other liquids including biofuels and natural gas liquids.

Natural Gas

Exploration and reserves, storage, imports and exports, production, prices, sales.

Electricity

Sales, revenue and prices, power plants, fuel use, stocks, generation, trade, demand & emissions.

Coal

Reserves, production, prices, employment and productivity, distribution, stocks, imports and exports.

Nuclear & Uranium

Uranium fuel, nuclear reactors, generation, spent fuel.

Renewable & Alternative Fuels

Includes hydropower, solar, wind, geothermal, biomass and ethanol.

EIA Survey Forms

Forms EIA uses to collect energy data including descriptions, links to survey instructions, and additional information.

Total Energy

Comprehensive data summaries, comparisons, analysis, and projections integrated across all energy sources.

U.S. States

State energy information, including overviews, rankings, data, and analyses.

International

International energy information, including overviews, rankings, data, and analyses.

Environment

Greenhouse gas data, voluntary reporting, electric power plant emissions.

Data Tools, Apps, & Maps

Tools to customize searches, view specific data sets, study detailed documentation, and access time-series data.

Open Data

EIA's free and open data available as API, Excel add-in, bulk files, and widgets

EIA Beta

Come test out some of the products still in development and let us know what you think!

Open Source Code

EIA's open source code, available on GitHub.

RSS Feeds

Subscribe to feeds for updates on EIA products including Today in Energy and What's New.