
Oil trade off Yemen coast grew by 20% to 4.7 million barrels per day in 2014
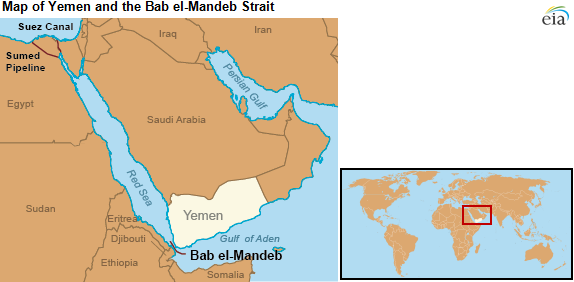
While Yemen is not a major oil-producing country, its coast borders the Bab el-Mandeb Strait, a narrow chokepoint between the Horn of Africa and the Middle East. This strait is a strategic route for Persian Gulf oil, natural gas, and petroleum product shipments to Europe and North America, as well as European and North African oil exports to Asia. Although the strait is 18 miles wide at its narrowest point, tankers passing through must use two 2-mile-wide shipping channels.
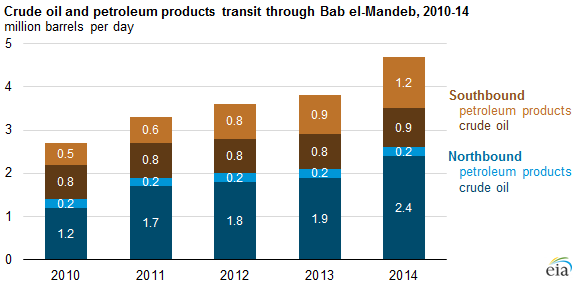
Trade in crude oil and petroleum products transiting the Bab el-Mandeb has increased steadily in recent years, growing from 2.7 million barrels per day (bbl/d) in 2010 to almost 4.7 million bbl/d in 2014. From 2013 to 2014, trade grew by more than 20%, with an increase of more than 200,000 bbl/d in crude oil exports from Iraq to Europe contributing to higher northbound traffic.
Record-level exports of crude oil and petroleum products (particularly distillate fuel oil) from Russia to Asia contributed the most to higher southbound traffic through the strait, somewhat offset by declines in exports of petroleum products from Europe and exports of crude oil from Libya. About 30% of Bab el-Mandeb's southbound traffic also passed through the Suez Canal or the Suez-Mediterranean (Sumed) pipeline.
While oil trade volume has increased over the past five years through the Bab el-Mandeb, liquefied natural gas (LNG) shipments through the strait have declined. Middle East LNG exporters, especially Qatar, have been steadily exporting more LNG to Asia, while European imports of LNG have declined. More than 2 trillion cubic feet (Tcf) of LNG passed through the strait in 2011, roughly 18% of world LNG trade. By 2014 EIA estimates the volume fell to about 1.2 Tcf, or only 10% of world LNG trade.
Increased instability around the Bab el-Mandeb could keep tankers in the Persian Gulf from reaching the Suez Canal or the Sumed Pipeline, diverting them around the southern tip of Africa, adding to transit time and cost. In addition, European and North African southbound oil flows could no longer take the most direct route to Asian markets through the Suez Canal and then on to the Bab el-Mandeb. As the security situation in Yemen has continued to deteriorate, the United States has heightened maritime security in the area, and has announced its intention to work with Gulf Cooperation Council partners to ensure the continued flow of commerce though the strait.
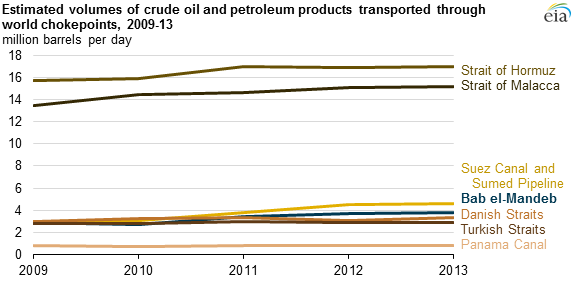
Note: Data for Panama Canal reflect fiscal years.
For more information, see the World Oil Transit Chokepoints special analysis brief and Yemen country analysis brief.
Principal contributor: Alexander Metelitsa