
Most electric generating capacity additions in the last decade were natural gas-fired
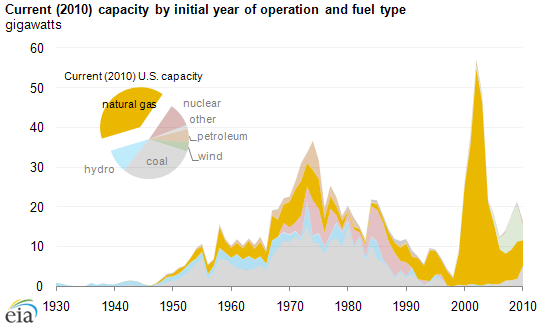
Note: Data for 2010 are preliminary. Generators with online dates earlier than 1930 are predominantly hydroelectric. Data include non-retired plants existing as of year-end 2010. This chart shows the most recent (summer) capacity data for each generator. However, this number may change over time, if a generator undergoes an uprate or derate.
Download CSV Data
The June 16 edition of Today in Energy examined the wide age range of all electric power generators for all fuels; today's article looks specifically at natural gas-fired generators. At the end of 2010, natural gas-fired generators constituted 39% of the Nation's total electric generation capacity of 1,042 gigawatts (GW). Nearly 237 GW of natural gas-fired generation capacity was added between 2000 and 2010, representing 81% of total generation capacity additions over that period.
Capacity additions for most fuels decreased during the 1980s, compared to the 1970s. This reflected several factors, including a lower growth rate for electric power demand in the 1980s 1 and capacity overbuilding during the 1970s. In the case of natural gas, other factors were supply shortages and price increases in the 1970s and early 1980s. In addition, the Federal Powerplant and Industrial Fuel Use Act of 1978 discouraged the use of natural gas and petroleum for power generation.
By the late 1980s and early 1990s, an improved price and supply outlook for natural gas, and more efficient combined-cycle technology, encouraged greater use of natural gas for power generation (the restrictive provisions of the Fuel Use Act were repealed in 1987). With power industry restructuring in the 1990s, the construction of new power plants was dominated by independent power producers who favored natural gas generation due to short construction times and low capital costs.
About 65% of the existing natural gas capacity added after 1980 is combined-cycle units. As a whole, average utilization of the Nation's fleet of natural gas combined-cycle gas has been increasing over the past six years. Other recent natural gas capacity additions are primarily combustion turbines, typically used as peaking units. Most of the natural gas-fired capacity additions from the 1950s through the 1970s were steam turbines—some of these were dual-fired units capable of burning natural gas and oil. However, air pollution restrictions and the current price differences between gas and oil mean that these units are primarily burning gas. Although these gas-fired steam units were built as baseload generators, they now operate as load-following or peaking generators, that are dispatched only when higher efficiency, combined-cycle units are fully utilized or are otherwise unavailable to serve load requirements.
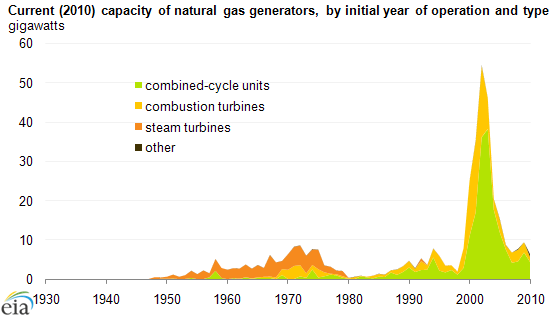
Note:Data for 2010 are preliminary. Generators with online dates earlier than 1930 are predominantly hydroelectric. Data include non-retired plants existing as of year-end 2010. The prime mover type refers to the type of generator.
Download CSV Data