
Updated geologic maps provide greater detail for Marcellus formation
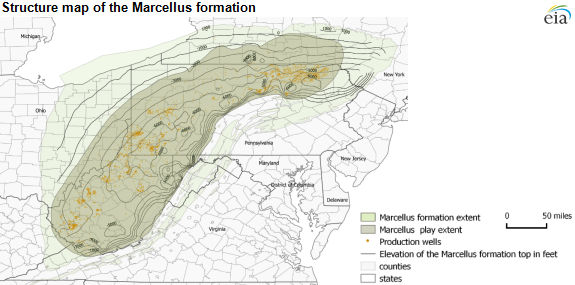
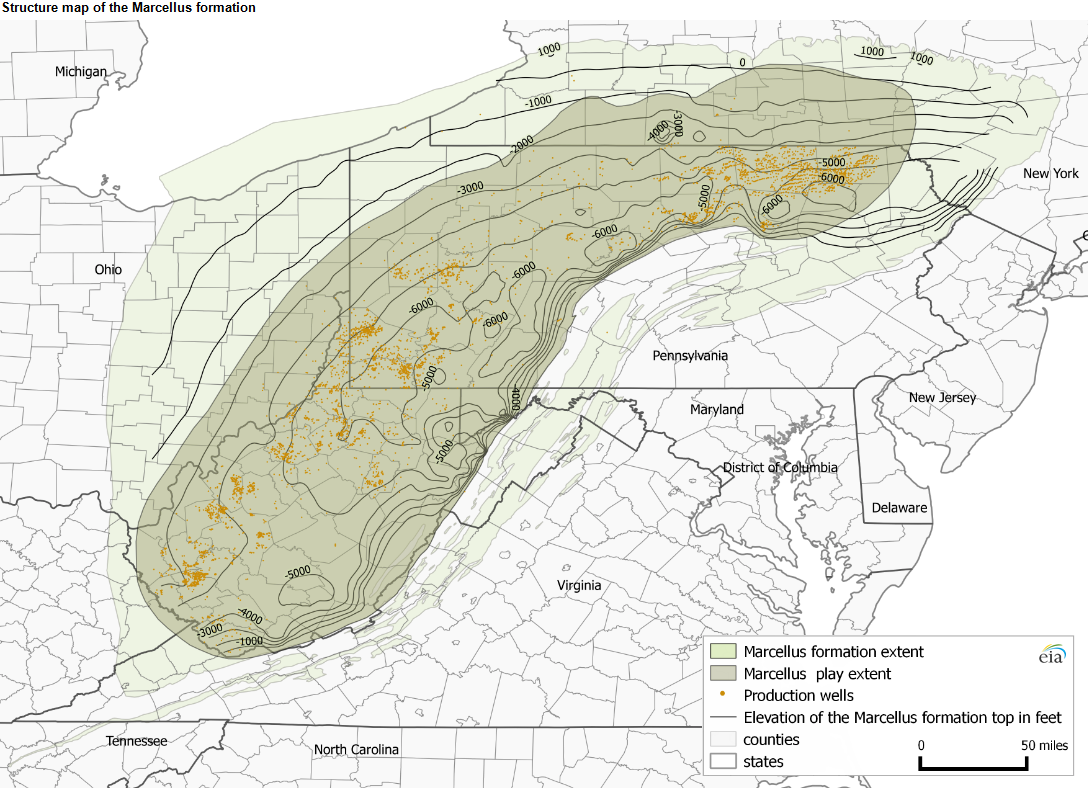
Note: Map includes production wells from January 2003 through December 2014. Click to enlarge.
Natural gas production from the Marcellus shale formation in the Appalachian basin increased to 14.4 billion cubic feet per day (Bcf/d) in January 2015, accounting for more than 36% of shale gas production and more than 18% of total dry natural gas production in the United States, according to EIA's Natural Gas Weekly Update. Recent updates to EIA's maps and geologic information for the Marcellus shale play help to characterize the formation's structure, thickness, and extent.
EIA uses well data to construct maps showing the formation extent and structure of the productive and prospectively productive regions of the Marcellus. Structure and thickness maps are key elements in resource estimation and in defining the areas where hydrocarbon extraction is economical. Maps showing the top and bottom of the formation as 3-D surfaces can be used for a rough estimation of subsurface volumes, as well as detection of regional structural and tectonic features such as major faults, folds, and thrusts.
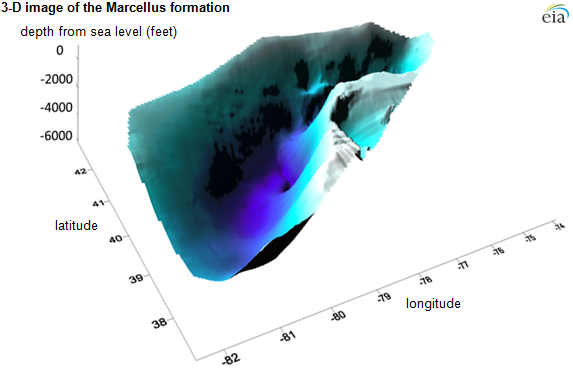
Note: Figure presents a three-dimensional image of the surface of the top of the Marcellus formation.
To generate formation structure and thickness (isopach) maps, EIA uses stratigraphic correlations provided by state geological survey agencies based on data from 2,416 wells. The Marcellus currently produces in four states: Pennsylvania, West Virginia, Ohio, and New York. Because hydraulic fracturing had been effectively suspended (and more recently banned) in New York, natural gas production in New York reflects production from wells drilled prior to 2010.
The Marcellus Middle Devonian-age shale extends from New York in the north to Kentucky and Tennessee in the south and is the most prolific natural gas-producing formation in the Appalachian basin. The formation's and play's footprints cover about 95,000 square miles and 72,000 square miles, respectively. The Marcellus formation consists of several sublayers that are grouped in the Lower and Upper Marcellus intervals. The Lower Marcellus has a significantly higher organic matter concentration compared with the Upper Marcellus.
The top of the Marcellus formation ranges in elevation from 1,000 feet to 8,000 feet below sea level (or about 100 feet to 9,900 feet below the surface) and primarily produces natural gas in northeast Pennsylvania, but becomes more liquids-rich (lower yields or lower natural gas-to-oil ratios) in less thermally mature areas of southwestern Pennsylvania, West Virginia, and southeastern Ohio. Thermal maturity reflects the temperatures that the source rock was exposed to over geologic time. Source rock only produces hydrocarbons within a limited temperature range.
As the structure map and 3-D image show, the Appalachian basin is an asymmetric depression. The depth of the Marcellus formation increases gradually from northwest to southeast with an abrupt uplift along the western edge of the Appalachian Mountains, where the formation is exposed to the ground surface. Most of the producing wells are located in areas where the subsea depth of the formation is 2,000 feet to 6,000 feet below sea level.
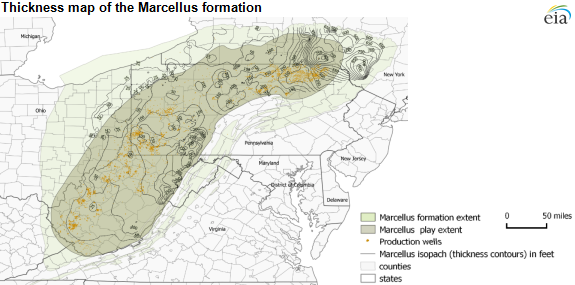
Note: Map includes production wells from January 2003 through December 2014. Isopach lines represent formation thickness with a 50-foot contour interval. An additional 25-foot isopach is shown as a dotted line on the western edge. Click to enlarge.
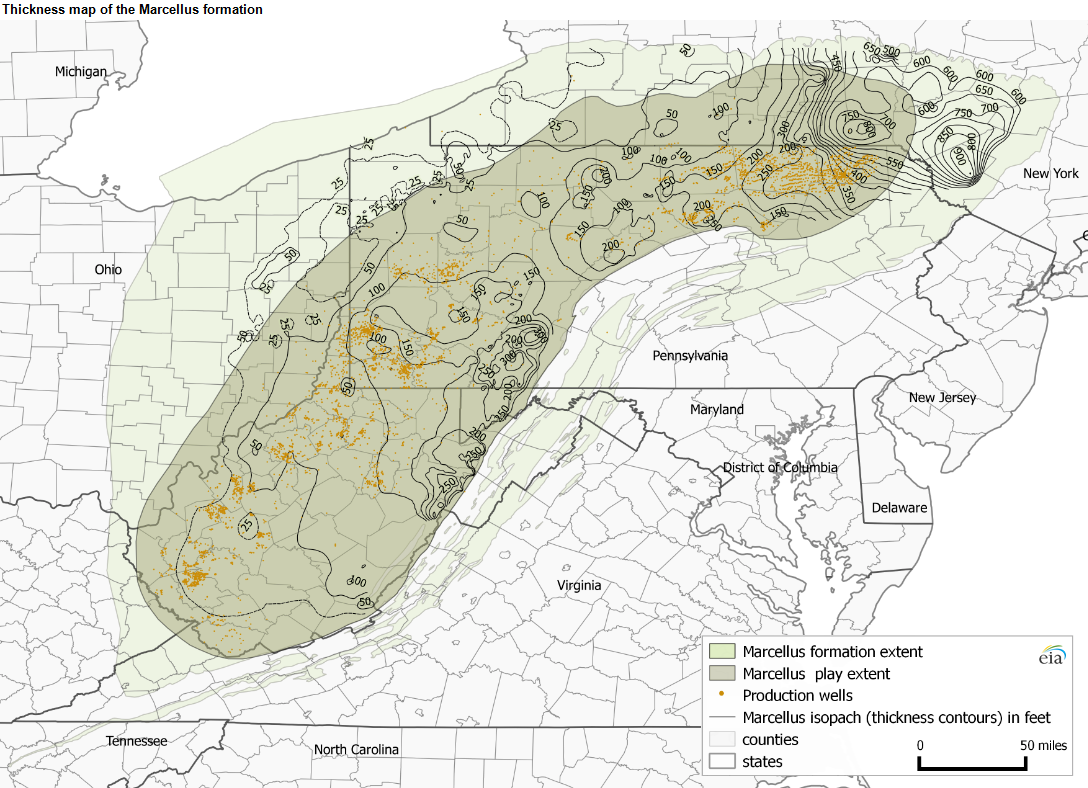
The Marcellus range is up to 950 feet thick and generally shows a decrease in thickness westward from the central part of the basin and pinches out in the subsurface along its eastern limit. The thick, potentially natural gas-rich interval extends southwest in an arc through New York, Pennsylvania, and West Virginia and runs parallel to the western edge of the Appalachian Mountains. Most of the current production is located in areas where formation thickness is greater than 50 feet.
The Marcellus is one of several oil and natural gas formations with updated geologic detail. Earlier this year, EIA updated geologic maps for the Eagle Ford play in Texas. Additionally, EIA published updated shapefiles for the following plays: Abo-Yeso, Bone Spring, Delaware, Glorieta-Yeso, and Spraberry; Bakken and Three Forks; Eagle Ford; Marcellus; and Niobrara.
Principal contributors: Olga Popova, Evan Frye, Elizabeth Panarelli
Tags: map, Marcellus, natural gas, production/supply