U.S. commercial crude oil inventories now provide the most days of supply since 1985
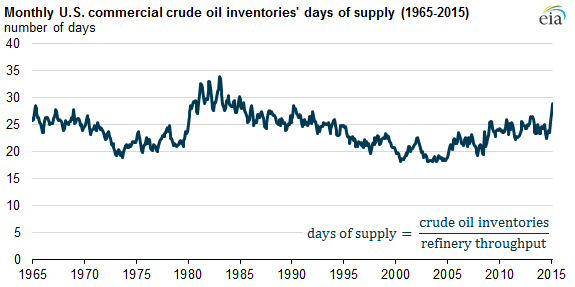
Note: U.S. crude oil inventories exclude Strategic Petroleum Reserves. December 2014 to February 2015 are estimates.
With lower U.S. refinery runs and increases in domestic crude oil production, U.S. commercial crude oil inventories at the end of February provided the most days of supply since the mid-1980s. Commercial crude inventories were sufficient to supply 29 days of U.S. refinery demand, based on expected refinery runs in March.
The number of days of supply is calculated by dividing the commercial crude oil inventory level at the end of the month by the forecast crude oil refinery runs in the following month. This calculation excludes government-held inventories such as the U.S. Strategic Petroleum Reserve. The days-of-supply calculation is an indicator of how loose or tight oil markets are by showing the number of days current commercial inventories will last given the future consumption rate at refineries. Refinery runs (or throughput) are the amount of crude oil that refineries process and are used as a proxy to measure the consumption rate.
As explained in This Week in Petroleum, commercial crude oil inventories across all Organization for Economic Cooperation and Development (OECD) countries are also high, but to a lesser extent than U.S. inventories considered alone. OECD crude oil inventories in January were sufficient to supply almost 28 days of OECD crude oil demand. However, unlike in the United States, OECD inventories have exceeded 28 days of supply in several months over the previous two years.
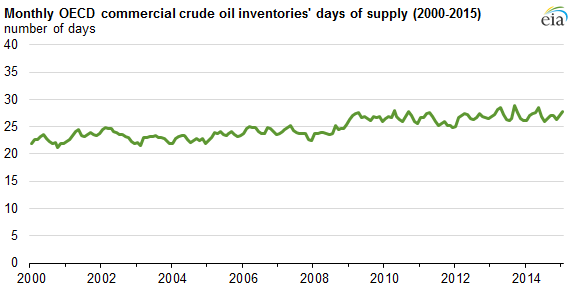
Note: Organization for Economic Cooperation and Development (OECD) crude oil stocks exclude government-held stocks. December 2014 and January 2015 are estimates.
The recent increase in U.S. crude oil inventories (both absolutely and on a days-of-supply basis) in January and February, compared with the more typical OECD days-of-supply, helps to explain why the February increase of U.S. crude oil prices, such as the benchmark West Texas Intermediate (WTI), was smaller compared to the February price increase of the international benchmark Brent. The Brent-WTI price spread settled at $7.53 per barrel on March 10, an increase from the start of the year, when these prices were nearly equal. Other factors that have led to a wider Brent-WTI spread are planned and unplanned refinery maintenance in the United States and increased refinery use in Europe.
Principal contributors: Hannah Breul, James Preciado, Asmeret Asghedom
Tags: crude oil, inventories/stocks, liquid fuels, OECD