U.S. Energy Information Administration logo
Skip to sub-navigation
June 29, 2011

January 2011 U.S. refining capacity was the highest in 29 years
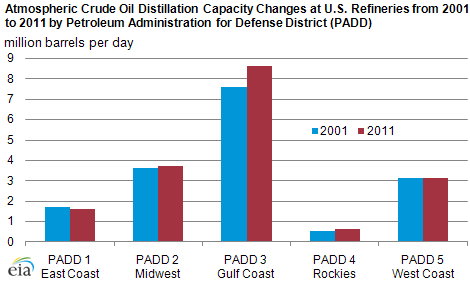
graph of Atmospheric crude oil distillation capacity changes at U.S. refineries from 2001 to 2011 by Petroleum Administration for Defense District (PADD), as described in the article text

Source: U.S. Energy Information Administration, Refinery Capacity Report
Note: Capacities are as of January 1.
Download CSV Data

Atmospheric crude oil distillation capacity at U.S. refineries was 17.7 million barrels per day at the beginning of 2011 according to the U.S. Energy Information Administration's Refinery Capacity Report. Capacity, which was 0.15 million barrels per day above its level at the start of 2010, reached the highest level recorded since 1982. Since 2001, total net U.S. refinery capacity grew by more than 1 million barrels per day.

Nearly half (49%) of U.S. refinery distillation capacity is located in the Gulf Coast region, which is Petroleum Administration for Defense District (PADD) 3, up from 46% in 2001. Most expansions of refinery distillation capacity have taken place at the larger refineries and most of these large refineries are located in PADD 3. The regional distribution of U.S. refinery distillation capacity outside of PADD 3 at the beginning of 2011 was 9% on the East Coast (PADD 1), 21% in the Midwest (PADD 2), 4% in the Rocky Mountains region (PADD 4), and 18% on the West Coast (PADD 5).

The last major brand new U.S. refinery started operating in 1977 at Garyville, Louisiana. Since then, distillation capacity expansions have come from construction of relatively small refineries and expansion of existing plants. Decreases in refinery distillation capacity resulted mostly from plants that were shut down. In recent years, some refineries have temporarily ceased operation for economic reasons but continue to be counted as operable capacity if they can be returned to service within 30 days.

Statistics
Analysis
Tools
Education
News

Petroleum & Other Liquids

Crude oil, gasoline, heating oil, diesel, propane, and other liquids including biofuels and natural gas liquids.

Natural Gas

Exploration and reserves, storage, imports and exports, production, prices, sales.

Electricity

Sales, revenue and prices, power plants, fuel use, stocks, generation, trade, demand & emissions.

Coal

Reserves, production, prices, employment and productivity, distribution, stocks, imports and exports.

Nuclear & Uranium

Uranium fuel, nuclear reactors, generation, spent fuel.

Renewable & Alternative Fuels

Includes hydropower, solar, wind, geothermal, biomass and ethanol.

EIA Survey Forms

Forms EIA uses to collect energy data including descriptions, links to survey instructions, and additional information.

Total Energy

Comprehensive data summaries, comparisons, analysis, and projections integrated across all energy sources.

U.S. States

State energy information, including overviews, rankings, data, and analyses.

International

International energy information, including overviews, rankings, data, and analyses.

Environment

Greenhouse gas data, voluntary reporting, electric power plant emissions.

Data Tools, Apps, & Maps

Tools to customize searches, view specific data sets, study detailed documentation, and access time-series data.

Open Data

EIA's free and open data available as API, Excel add-in, bulk files, and widgets

EIA Beta

Come test out some of the products still in development and let us know what you think!

Open Source Code

EIA's open source code, available on GitHub.

RSS Feeds

Subscribe to feeds for updates on EIA products including Today in Energy and What's New.