
Increase in average gasoline prices ends 17-week streak of declining prices
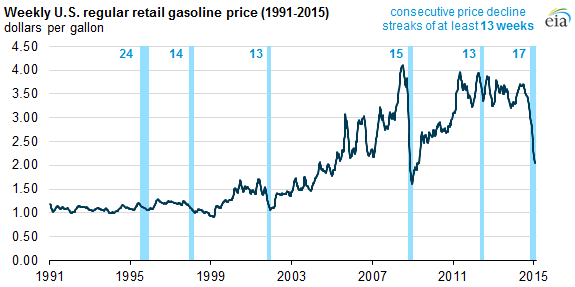
EIA conducts a survey of gasoline prices each Monday, and yesterday's survey showed the U.S. average regular retail gasoline price increasing for the first time in 18 weeks. The national price averaged $2.07/gallon on Monday, up 2.4 cents from a week earlier. The steady decline in prices over the previous 17 weeks was the longest consecutive decrease in EIA's weekly survey since prices fell 14 cents per gallon over a 24-week period in 1995. The decline is the largest percentage decline since a 58% drop in gasoline prices over 15 weeks in late 2008. With oil prices at around $45 per barrel (bbl), petroleum refinery outages in the Midwest and Gulf Coast regions in January pushed wholesale spot gasoline prices, and ultimately retail gasoline prices, up at the end of January. Those increases were large enough to raise the national average gasoline price in yesterday's EIA survey.
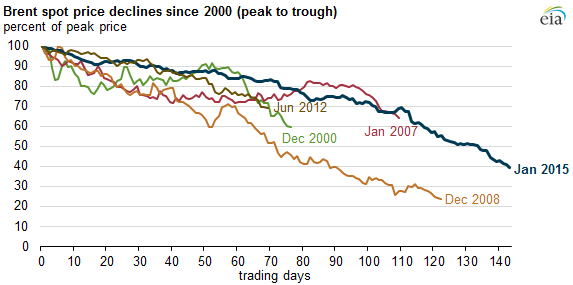
U.S. gasoline prices tend to follow the price of North Sea Brent crude oil, an international benchmark. The Brent crude price fell from $115/bbl on June 19, 2014, to $45/bbl on January 13, 2015. This decline, which lasted 143 trading days, was the longest price decline in the past 15 years. Only the price drop during the 2008 financial crisis was steeper, when prices fell from $144/bbl to $34/bbl over 122 trading days.
As explained in This Week in Petroleum, high refinery output and seasonally low gasoline demand in December 2014 led to inventories building higher than five-year averages, which pushed spot gasoline prices lower. In the Midwest and Gulf Coast, refinery utilization in December averaged more than 97% and 96%, respectively. In mid-to-late January, multiple refinery outages (both planned and unplanned) in the Midwest and Gulf Coast regions increased gasoline spot prices, which are reflected in pump prices with a short lag. In last Monday's survey, average retail prices in these regions first turned upward. Yesterday's survey saw the first upturn in national average prices.
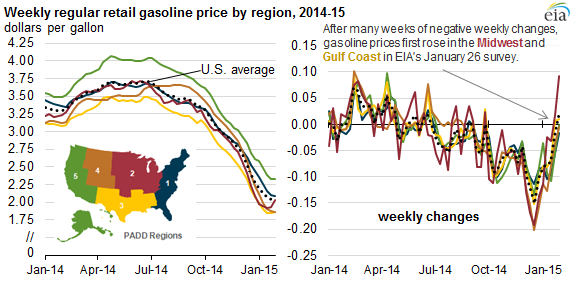
Note: PADD is Petroleum Administration for Defense District
Principal contributor: Hannah Breul, T. Mason Hamilton
Tags: Brent, crude oil, gasoline, liquid fuels, oil/petroleum, prices, refining