32% of natural gas pipeline capacity into the Northeast could be bidirectional by 2017
Note: In this context, the Northeast includes the Northeast Census region as well as Delaware, Maryland, Ohio, and West Virginia.
Republished December 2, 2014, 11:00 a.m. to update text.
Spurred by growing natural gas production in Pennsylvania, West Virginia, and Ohio, the natural gas pipeline industry is planning to modify its systems to allow bidirectional flow to move up to 8.3 billion cubic feet per day (Bcf/d) out of the Northeast. As of 2013, the industry had the capacity to transport 25 Bcf/d of natural gas from Canada, the Midwest, and the Southeast into the Northeast. In addition to these bidirectional projects in the Northeast, the industry plans to expand existing systems and build new systems to transport natural gas produced in the Northeast to consuming markets outside the region.
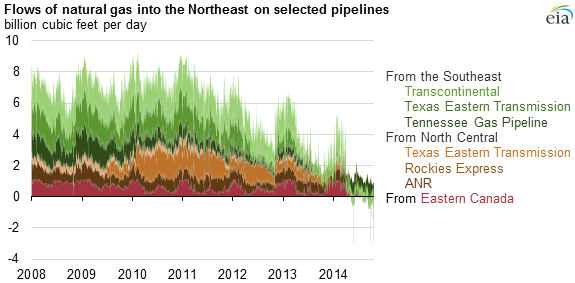
Flows on ANR Pipeline, Texas Eastern Transmission, Transcontinental Pipeline, Iroquois Gas Pipeline, Rockies Express Pipeline, and Tennessee Gas Pipeline accounted for 60% of flows to the Northeast in 2013. Flows on these pipelines in 2013 were between 21% and 84% below 2008 levels, with the largest percentage decline occurring on the Tennessee Gas Pipeline. In 2014, the Tennessee Gas Pipeline and the Texas Eastern Transmission began flowing gas both ways between states along the Northeast and Southeast region borders.
As a result of these pipelines being underutilized, the pipeline companies have announced plans to modify their systems to allow for bidirectional flow, adding the ability to send natural gas out of the Northeast region:
- Columbia Gulf Transmission completed two bidirectional projects in 2013 and 2014 that enable the system to transport natural gas from Pennsylvania to Louisiana.
- ANR Pipeline, Tennessee Gas Pipeline, Texas Eastern Transmission, and Transcontinental Gas Pipeline are planning to send natural gas from the Northeast to the Gulf Coast because of the potential of industrial demand and LNG exports from the Gulf Coast. These projects total 5.5 Bcf/d of flow capacity.
- The Rockies Express Pipeline's partial bidirectional project (2.5 Bcf/d of capacity) is primarily to flow Marcellus natural gas to more attractive markets in Chicago, Detroit, and the Gulf Coast.
- The Iroquois Gas Pipeline's bidirectional project (0.3 Bcf/d of capacity) will deliver natural gas from the Marcellus to Canada. Iroquois will receive gas from the Dominion, Constitution (expected in service in 2016), and Algonquin pipelines.
Rationales for modifying existing pipelines rather than building new pipelines include:
- Modifying existing pipeline to enable bidirectional flow requires significantly less capital investment, fewer regulatory permits, and lower construction and labor costs, while resulting in fewer environmental impacts.
- Existing long-haul pipeline capacities to flow gas into the Northeast are underutilized. Modifying these systems to be bidirectional can be executed quickly to respond to new market dynamics that will improve pipeline utilization rates.
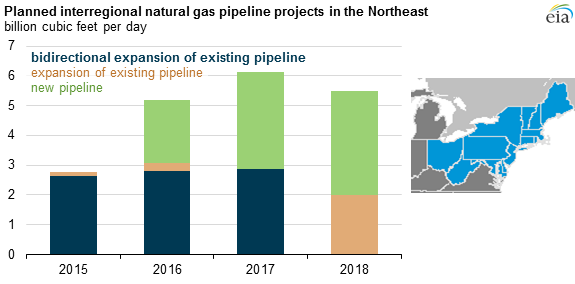
In addition to bidirectional pipeline projects, the industry is planning to build 35 Bcf/d of additional capacity to support the growth of natural gas production in the Northeast. As of November 7, 2014, the industry added more than 2 Bcf/d of additional capacity in the Northeast, following 1.6 Bcf/d of additional capacity coming online a week earlier. Even though the Northeast has seen increased natural gas production and new infrastructure, consumers in New England continue to pay high natural gas prices during peak demand days. Algonquin Gas Transmission and Tennessee Gas Pipeline, which supply most of the natural gas to New England, plan to increase their capacities into New England by 4.1 Bcf/d by the end of 2018. These proposed additions could increase natural gas supply in New England and reduce extreme prices at the Algonquin Citygate, near Boston on peak demand days.
Principal contributor: Tu Tran
Tags: capacity, natural gas, pipelines