Shale gas provides largest share of U.S. natural gas production in 2013
Republished November 25, 2014, 10:15 a.m. to clarify graph title.
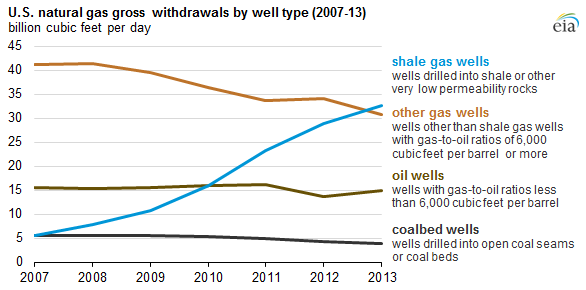
Total U.S. natural gas gross withdrawals reached a new high at 82 billion cubic feet per day (Bcf/d) in 2013, with shale gas wells becoming the largest source of total natural gas production. Natural gas gross withdrawals are a measure of full well stream production including all natural gas plant liquids and nonhydrocarbon gases after oil, lease condensate, and water have been removed. According to the Natural Gas Annual, gross withdrawals from shale gas wells increased from 5 Bcf/d in 2007 to 33 Bcf/d in 2013, representing 40% of total natural gas production, and surpassing production from nonshale natural gas wells. New technology has enabled producers to shift production to resources that are now easier to reach and have lower drilling costs. These trends have been reflected in a lower market price of natural gas.
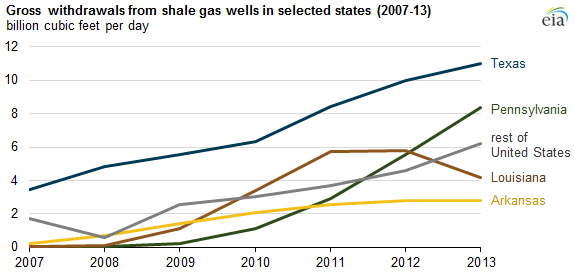
In 2007, shale gas wells made up 8% of total natural gas produced in the United States, with 63% of shale gas production coming from Texas. Since then, the distribution of shale gas production by state has changed significantly in the United States, especially in Texas, Pennsylvania, Louisiana, and Arkansas. These states accounted for 26 Bcf/d, or 79%, of U.S shale production in 2013.
- Texas shale gas production increased from 3 Bcf/d in 2007 to 11 Bcf/d in 2013. Most of its shale gas production growth came from the Barnett, Eagle Ford, and Haynesville-Bossier plays.
- Pennsylvania became the second-largest shale gas producing state in 2013, producing 8 Bcf/d, with almost all the growth coming from the Marcellus play. Shale gas production from the Utica play is increasing, but this volume remains small by comparison.
- Louisiana produced a minimal amount of shale gas in 2007, but it produced 4 Bcf/d in 2013. All of this growth came from the Haynesville play.
- Arkansas became the fourth-largest shale gas producing state, accounting for 2.8 Bcf/d, or 9%, of U.S. shale gas production in 2013. All of its shale gas production growth came from the Fayetteville play.
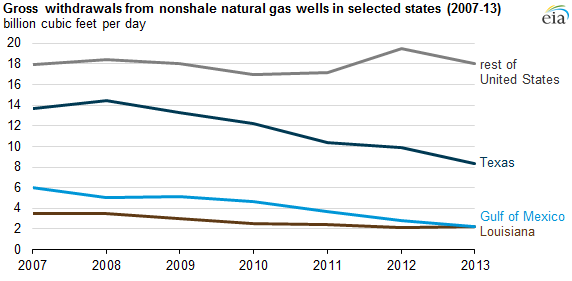
Total U.S. gross natural gas production from nonshale natural gas wells decreased by 25% from 41 Bcf/d in 2007 to 31 Bcf/d in 2013. Production from nonshale natural gas wells in Texas, Louisiana, and the Gulf of Mexico made up 56% of total U.S. gross production from nonshale natural gas wells in 2007, but their combined share has declined to 41% in 2013. Over this period, production from nonshale natural gas wells in these states decreased by 45% to 13 Bcf/d in 2013 mostly because of natural depletion and a relatively low number of new nonshale natural gas wells in these states. Even though production from nonshale natural gas wells decreased between 2007 and 2013 on a national basis, production from nonshale natural gas wells in some states, notably Colorado, the sixth-largest natural gas producing state, increased over this period.
Principal contributor: Tu Tran