
Boston, New York City winter natural gas prices expected to remain high
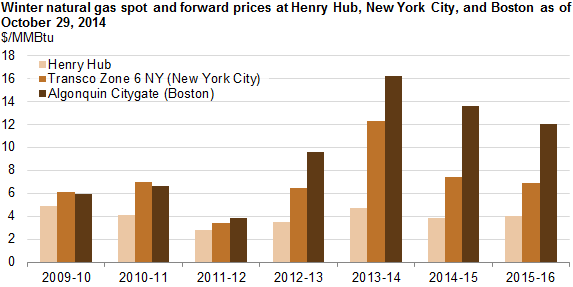
Note: November through March are considered winter months. Forward prices for 2014-15 and 2015-16 are as of 10/29/2014.
Despite expectations of a milder winter for 2014, marketers anticipate high prices for natural gas in Boston and New York City. Natural gas prices are expected to be lower than last winter, but higher than the average of previous winters, particularly in Boston.
Boston. Average forward prices in Boston this winter are expected to be $13.70 per million British thermal unit (MMBtu), which is $2.33/MMBtu lower than the winter of 2013-14 but much higher than previous winters. Higher natural gas prices are partly because the pipeline industry has not added any new capacity to flow more Marcellus gas into Boston and because production from eastern Canada and liquefied natural gas (LNG) from the Everett (Boston) and Canaport (New Brunswick) terminals are not high enough to serve New England peak demand.
New York City. Forward prices for New York City for the winters of 2014-15 and 2015-16 are significantly lower than the spot prices for the unusually cold winter of 2013-14. The forward prices are still slightly higher than the spot prices for the 2012-13 winter, even though several pipeline expansion projects within the past two years have added new capacity to flow more natural gas from the Marcellus region into New York City.
Since the beginning of 2014, the pipeline industry has added 2 billion cubic feet per day (Bcf/d) of capacity in the Northeast and plans to add another 0.4 Bcf/d by the end of 2014. Significantly more pipeline projects were completed between 2012 and 2014 than in previous years, reflecting the need to expand the natural gas infrastructure in the Northeast to serve growing natural gas production in this region, particularly in Pennsylvania, Ohio, and West Virginia.
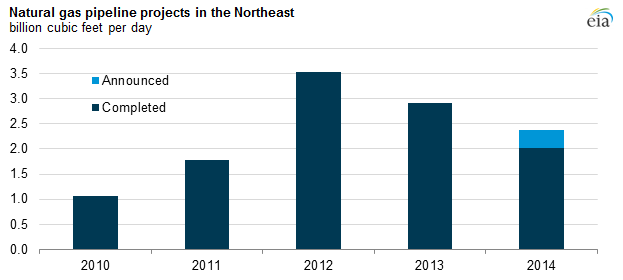
Major pipeline projects in 2014 include the following:
- Texas Eastern Transmission's TEAM 2014 expansion was partially completed as of October 29. This project expands the Texas Eastern system with looping and new compressor stations, which enables the system to transport an additional 0.6 Bcf/d of natural gas from western Pennsylvania and West Virginia to market areas in New Jersey, New York, and Ohio.
- The West Side Expansion Project (Smithfield III) was completed on October 27, 2014. This project enables Columbia Gas Transmission to flow 0.44 Bcf/d of gas from the Waynesburg, Pennsylvania and Smithfield, West Virginia areas to Leach, Kentucky, where the gas will be transported to the Gulf Coast on the Columbia Gulf Transmission pipeline.
- The Seneca lateral reversal project was completed on June 18, 2014. This project enables the Rockies Express Pipeline to flow 0.25 Bcf/d of gas west to points in Ohio, Indiana, and Illinois.
Principal contributors: Richard Yan, Tu Tran
Tags: natural gas, New England, New York, Pennsylvania, pipelines, prices, states