Natural gas is the dominant heating fuel in colder parts of the country
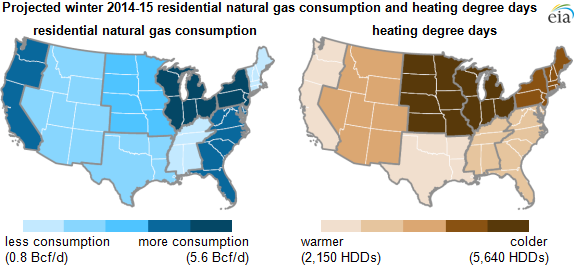
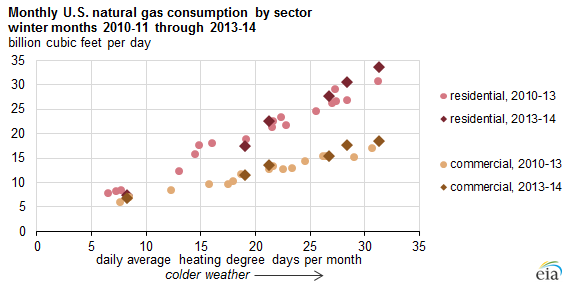
Natural gas consumption varies widely by region of the country. The majority of households that heat with natural gas are located in the Midwest and Northeast. In the upcoming winter months, homes in the East North Central Census division are expected to consume the most natural gas, but not as much as last winter. Extreme cold weather in natural gas-intensive regions caused unexpectedly high consumption during the winter of 2013-14.
Residential and commercial consumers use natural gas primarily for space heating. The East North Central Census division (Wisconsin, Michigan, Illinois, Indiana, and Ohio) is the largest residential and commercial natural gas-consuming division in the country, making up 28% of all residential consumption and 24% of commercial consumption in 2013.
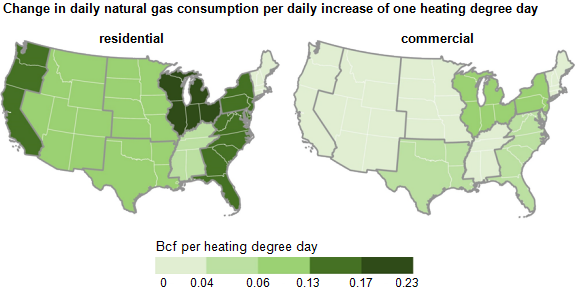
Because the East North Central Census division has the largest number of households heating with natural gas, its collective response to changes in weather (as measured by heating degree days) is greater than in any other region (see maps below). The response to changes in heating degree days in the South Atlantic Census division (which has about 6 million homes that heat primarily with natural gas) is similar to that of the Pacific and Mid-Atlantic Census divisions (where 10.2 and 9.4 million households, respectively, heat with natural gas). This response may be attributable to natural gas used as a secondary heat source, like in natural gas fireplaces or as the supplemental heat source to air-source heat pumps. When temperatures drop below a certain threshold (usually around freezing temperatures), heat pumps rely on a supplemental heat source.
The National Oceanic and Atmospheric Administration projects that temperatures this coming winter will be closer to normal. The most recent Short-Term Energy and Winter Fuels Outlook projects that residential and commercial prices will be higher than they were last year, largely because through 2014 (when utilities began buying natural gas for the upcoming winter) prices have averaged higher than year-ago levels, and are currently higher than a year ago. However, EIA projects lower residential heating bills for consumers because of lower consumption.
Principal contributor: Katie Teller
Tags: natural gas, weather