Menu
Crude oil, gasoline, heating oil, diesel, propane, and other liquids including biofuels and natural gas liquids.
Exploration and reserves, storage, imports and exports, production, prices, sales.
Sales, revenue and prices, power plants, fuel use, stocks, generation, trade, demand & emissions.
Energy use in homes, commercial buildings, manufacturing, and transportation.
Reserves, production, prices, employment and productivity, distribution, stocks, imports and exports.
Includes hydropower, solar, wind, geothermal, biomass and ethanol.
Uranium fuel, nuclear reactors, generation, spent fuel.
Comprehensive data summaries, comparisons, analysis, and projections integrated across all energy sources.
Monthly and yearly energy forecasts, analysis of energy topics, financial analysis, congressional reports.
Financial market analysis and financial data for major energy companies.
Greenhouse gas data, voluntary reporting, electric power plant emissions.
Maps, tools, and resources related to energy disruptions and infrastructure.
State energy information, including overviews, rankings, data, and analyses.
Maps by energy source and topic, includes forecast maps.
International energy information, including overviews, rankings, data, and analyses.
Regional energy information including dashboards, maps, data, and analyses.
Tools to customize searches, view specific data sets, study detailed documentation, and access time-series data.
EIA's free and open data available as API, Excel add-in, bulk files, and widgets
Come test out some of the products still in development and let us know what you think!
EIA's open source code, available on GitHub.
Forms EIA uses to collect energy data including descriptions, links to survey instructions, and additional information.
Sign up for email subscriptions to receive messages about specific EIA products
Subscribe to feeds for updates on EIA products including Today in Energy and What's New.
Short, timely articles with graphics on energy, facts, issues, and trends.
Lesson plans, science fair experiments, field trips, teacher guide, and career corner.
EIA is continuing normal publication schedules and data collection until further notice.
It is not unusual for the output of natural gas-fired generators to drop during the spring water run off season in the Pacific Northwest. What is unusual this year is that the hydro season began in mid-January and is expected to continue into August.
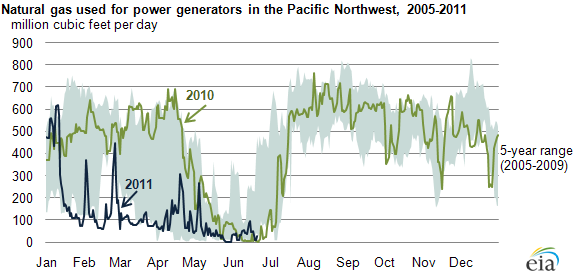
The chart shows last year's volume (green line) of natural gas use at selected natural gas-fired power plants in Idaho, Washington, and Oregon and this year's volume (dark blue line) to date, along with the 5-year range from 2005 to 2009 (shaded region). Natural gas use at these plants dropped almost to zero during the third week of May. This coincides with the curtailment of wind generators discussed in a previous Today in Energy article. Natural gas use for power generation in 2011 is down 68%, or about 300 million cubic feet per day, relative to the comparable 2010 period (January 1 - May 25).
Tags: electricity, hydroelectric, natural gas, Oregon, renewables, Washington