Lower electricity-related CO2 emissions reflect lower carbon intensity and electricity use
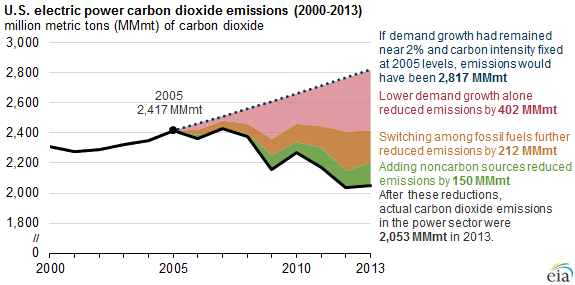
U.S. energy-related carbon dioxide emissions (CO2) have declined in five of the past eight years. This trend has been led by emissions reductions in the electric power sector. Electricity demand growth has been lower than in the past and at the same time the power sector has become less carbon intensive (measured as CO2 emitted per kilowatthour of generation). Total emissions from the electric power sector in 2013 totaled 2,053 million metric tons (MMmt), about 15% below their 2005 level.
U.S. electricity demand has decreased in recent years, as declines in the industrial sector continue to outweigh slight increases in residential and commercial demand. If electricity demand had continued to increase at its rate over the 1996-2005 period, emissions in 2013 would have been roughly 400 MMmt above actual 2013 levels, assuming carbon intensity remained constant.
The power sector has become less carbon intensive for two reasons: the substitution of less-carbon-intensive natural gas-fired generation, displacing coal and petroleum generation, and the growth in noncarbon generation, especially from renewables such as wind and solar.
The substitution of natural gas for other fossil fuels (mostly coal) has largely been market driven, as ample supplies of attractively priced natural gas and the relative ease of adding natural gas-fired capacity have often made it the fuel of choice for electric power generation. This was especially true in 2012, when natural gas prices were particularly low and natural gas provided 29% of total generation. In 2013 and 2014, market conditions have made coal generation more economically attractive, leading to a modest rise in coal-fired generation.
While the substitution of natural gas for coal has garnered significant attention, since 2005 the decline in the carbon intensity of total generation as a result of the increase in noncarbon power generation has also had an effect on emissions from power generation. The growth in noncarbon generation has been driven largely by state policies and federal tax incentives that have encouraged the use of renewables. These factors have particularly benefitted wind and solar energy sources; in 2005, wind and solar generation totaled 18 billion kWh, or about 2% of noncarbon generation, while by 2013 they generated 176 billion kWh, or 14% of noncarbon generation. Although nonhydroelectric renewables have shown steady growth, other noncarbon energy sources such as conventional hydroelectric power and nuclear power have fluctuated from year to year. In 2005, hydroelectric and nuclear power totaled 1,049 billion kWh (95% of noncarbon generation), and by 2013 totaled 1,055 million kWh (83% of noncarbon generation).
The overall decline in carbon intensity of electricity generation, through both reduced fossil fuel carbon intensity and increased noncarbon generation, has reduced cumulative CO2 emissions from power generation by about 1.6 billion metric tons since 2005. Including the decrease in electricity demand, growth since 2005 compared with the 1996-2005 period raises the cumulative effect on CO2 emissions from power generation to more than 3 billion MMmt of CO2.
Principal contributor: Perry Lindstrom