Lower demand, higher supply drive oil prices to lowest level since 2012
The price of North Sea Brent crude oil has fallen to around $91 per barrel, the lowest level in more than two years and about 21% lower than its year-to-date peak of $115 per barrel on June 19. Before its recent decline, average monthly Brent spot prices had traded within a narrow $5 per barrel range, from $107 to $112 per barrel, for 13 consecutive months through July 2014.
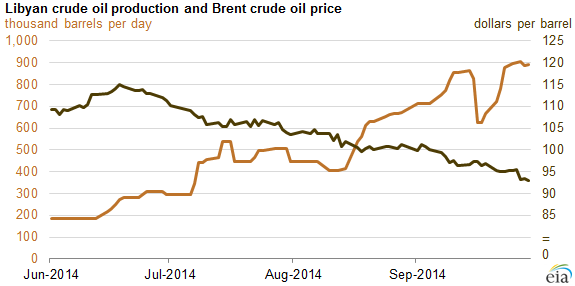
During that period of low price volatility, substantial oil supply disruptions in the Organization of the Petroleum Exporting Countries (OPEC) were offset by increases in U.S. production and weaker-than-expected global demand. More recently, however, the resumption of significant Libyan oil production, combined with the weakening outlook for global oil demand, has put downward pressure on prices.
The sustained increase in Libyan production over the summer—increasing from 200,000 barrels per day (bbl/d) in June to 900,000 bbl/d at the end of September—has added supplies to an already well-supplied light sweet crude market in the Atlantic Basin, despite the fact that Libya's recent production has not come close to its previous level of 1.65 million bbl/d in 2010 and 2011, before fighting that occurred during the Arab Spring.
Over the past several years, increasing U.S. light sweet crude production has significantly reduced light sweet crude imports to the United States. Those reduced imports, which were sourced primarily from Africa, became available to replace Libyan production lost during a time of civil war and subsequent unrest. While Libyan production was disrupted, supply and demand in the Atlantic Basin was relatively balanced. However, as Libyan production has returned and has remained largely online despite internal unrest, the price of Brent crude oil has fallen.
Although the return of significant Libyan production has been an important factor putting downward pressure on the Brent price, weakening global demand, particularly in Europe and Asia, is also important. Economic growth in 2014 outside of the United States has been slow, and recent data releases appear to confirm lower-than-expected growth, particularly in Asia and Europe.
China reported that its industrial production has risen at the slowest pace since 2008. In Europe, the Organization for Economic Cooperation and Development (OECD) has reduced expectations for economic growth through 2015 after data showed second-quarter 2014 gross domestic product (GDP) fell in Germany and Italy and stagnated in France.
Near-term seasonal market conditions are also reducing crude demand, as substantial refinery maintenance in the United States, Europe, and Asia takes place in September and October, reducing demand for crude. For more analysis, including near-term factors that could alter the current oil market landscape, see the September 24 This Week in Petroleum.
Principal contributor: Michael B. Leahy