U.S. Energy Information Administration logo
Skip to sub-navigation
September 29, 2014

New Eagle Ford wells continue to show higher production
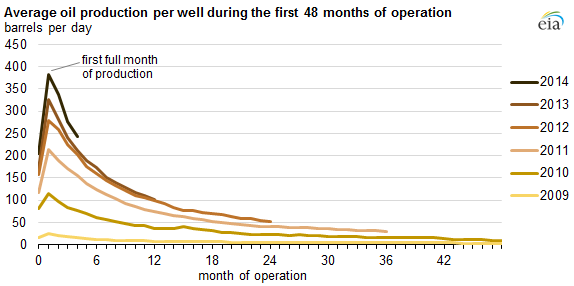
graph of average oil production per well during the first 48 months of operation, as explained in the article text
Source: U.S. Energy Information Administration, based on Drillinginfo

Increased drilling and improved drilling efficiency have led to significant crude oil production increases in the Eagle Ford region in southern Texas. These increases have occurred despite the region's relatively high well decline rates. However, by offsetting the natural declines through the use of new recovery techniques, further production increases are possible.

Horizontal drilling combined with an increasing number of hydraulic fracturing stages in tight formations like the Eagle Ford typically enhance initial production rates when compared to past results. These higher initial production rates are often accompanied by initially larger decline rates, before gradually leveling off to a consistent level of decline for the remaining years of the well life.

While initial production rates have steadily increased since 2009, first-year decline rates in the Eagle Ford have fluctuated between 60% and 70%. Most notably, decline rates over the second year of production have steadily increased from 30% for wells drilled in 2009 to nearly 50% for wells drilled in 2011 and 2012. Since 2013, many producers have been using significantly more proppant (sand or other material designed to keep a hydraulic fracture open) when hydraulically fracturing new wells, which appears to have increased initial production rates, but which was followed by a steeper drop in production.
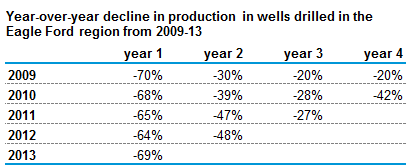
table of year-over-year decline in production in wells drilled in the Eagle Ford region from 2009-13, as explained in the article text
Source: U.S. Energy Information Administration, based on Drillinginfo

Principal contributors: Richard Yan, Jozef Lieskovsky, Sam Gorgen

Statistics
Analysis
Tools
Education
News

Petroleum & Other Liquids

Crude oil, gasoline, heating oil, diesel, propane, and other liquids including biofuels and natural gas liquids.

Natural Gas

Exploration and reserves, storage, imports and exports, production, prices, sales.

Electricity

Sales, revenue and prices, power plants, fuel use, stocks, generation, trade, demand & emissions.

Coal

Reserves, production, prices, employment and productivity, distribution, stocks, imports and exports.

Nuclear & Uranium

Uranium fuel, nuclear reactors, generation, spent fuel.

Renewable & Alternative Fuels

Includes hydropower, solar, wind, geothermal, biomass and ethanol.

EIA Survey Forms

Forms EIA uses to collect energy data including descriptions, links to survey instructions, and additional information.

Total Energy

Comprehensive data summaries, comparisons, analysis, and projections integrated across all energy sources.

U.S. States

State energy information, including overviews, rankings, data, and analyses.

International

International energy information, including overviews, rankings, data, and analyses.

Environment

Greenhouse gas data, voluntary reporting, electric power plant emissions.

Data Tools, Apps, & Maps

Tools to customize searches, view specific data sets, study detailed documentation, and access time-series data.

Open Data

EIA's free and open data available as API, Excel add-in, bulk files, and widgets

EIA Beta

Come test out some of the products still in development and let us know what you think!

Open Source Code

EIA's open source code, available on GitHub.

RSS Feeds

Subscribe to feeds for updates on EIA products including Today in Energy and What's New.